一种方法是最小二乘曲线拟合。您需要拟合一个参数化曲线 [x(t), y(t)],而不是一个简单的曲线 y(x)。根据您的链接,看起来您正在尝试拟合一个简单的曲线 y(x)。有一个方便的最小二乘样条拟合工具 SPLINEFIT 可以从 MATLAB 文件交换
这里 下载。使用此工具,以下是一个简单的示例,演示如何使用最小二乘样条拟合将平滑曲线拟合到一组嘈杂的数据中。在这种情况下,我生成了 10 个随机扰动的圆形数据集,然后以最小二乘方式对数据进行了 5 阶样条拟合。
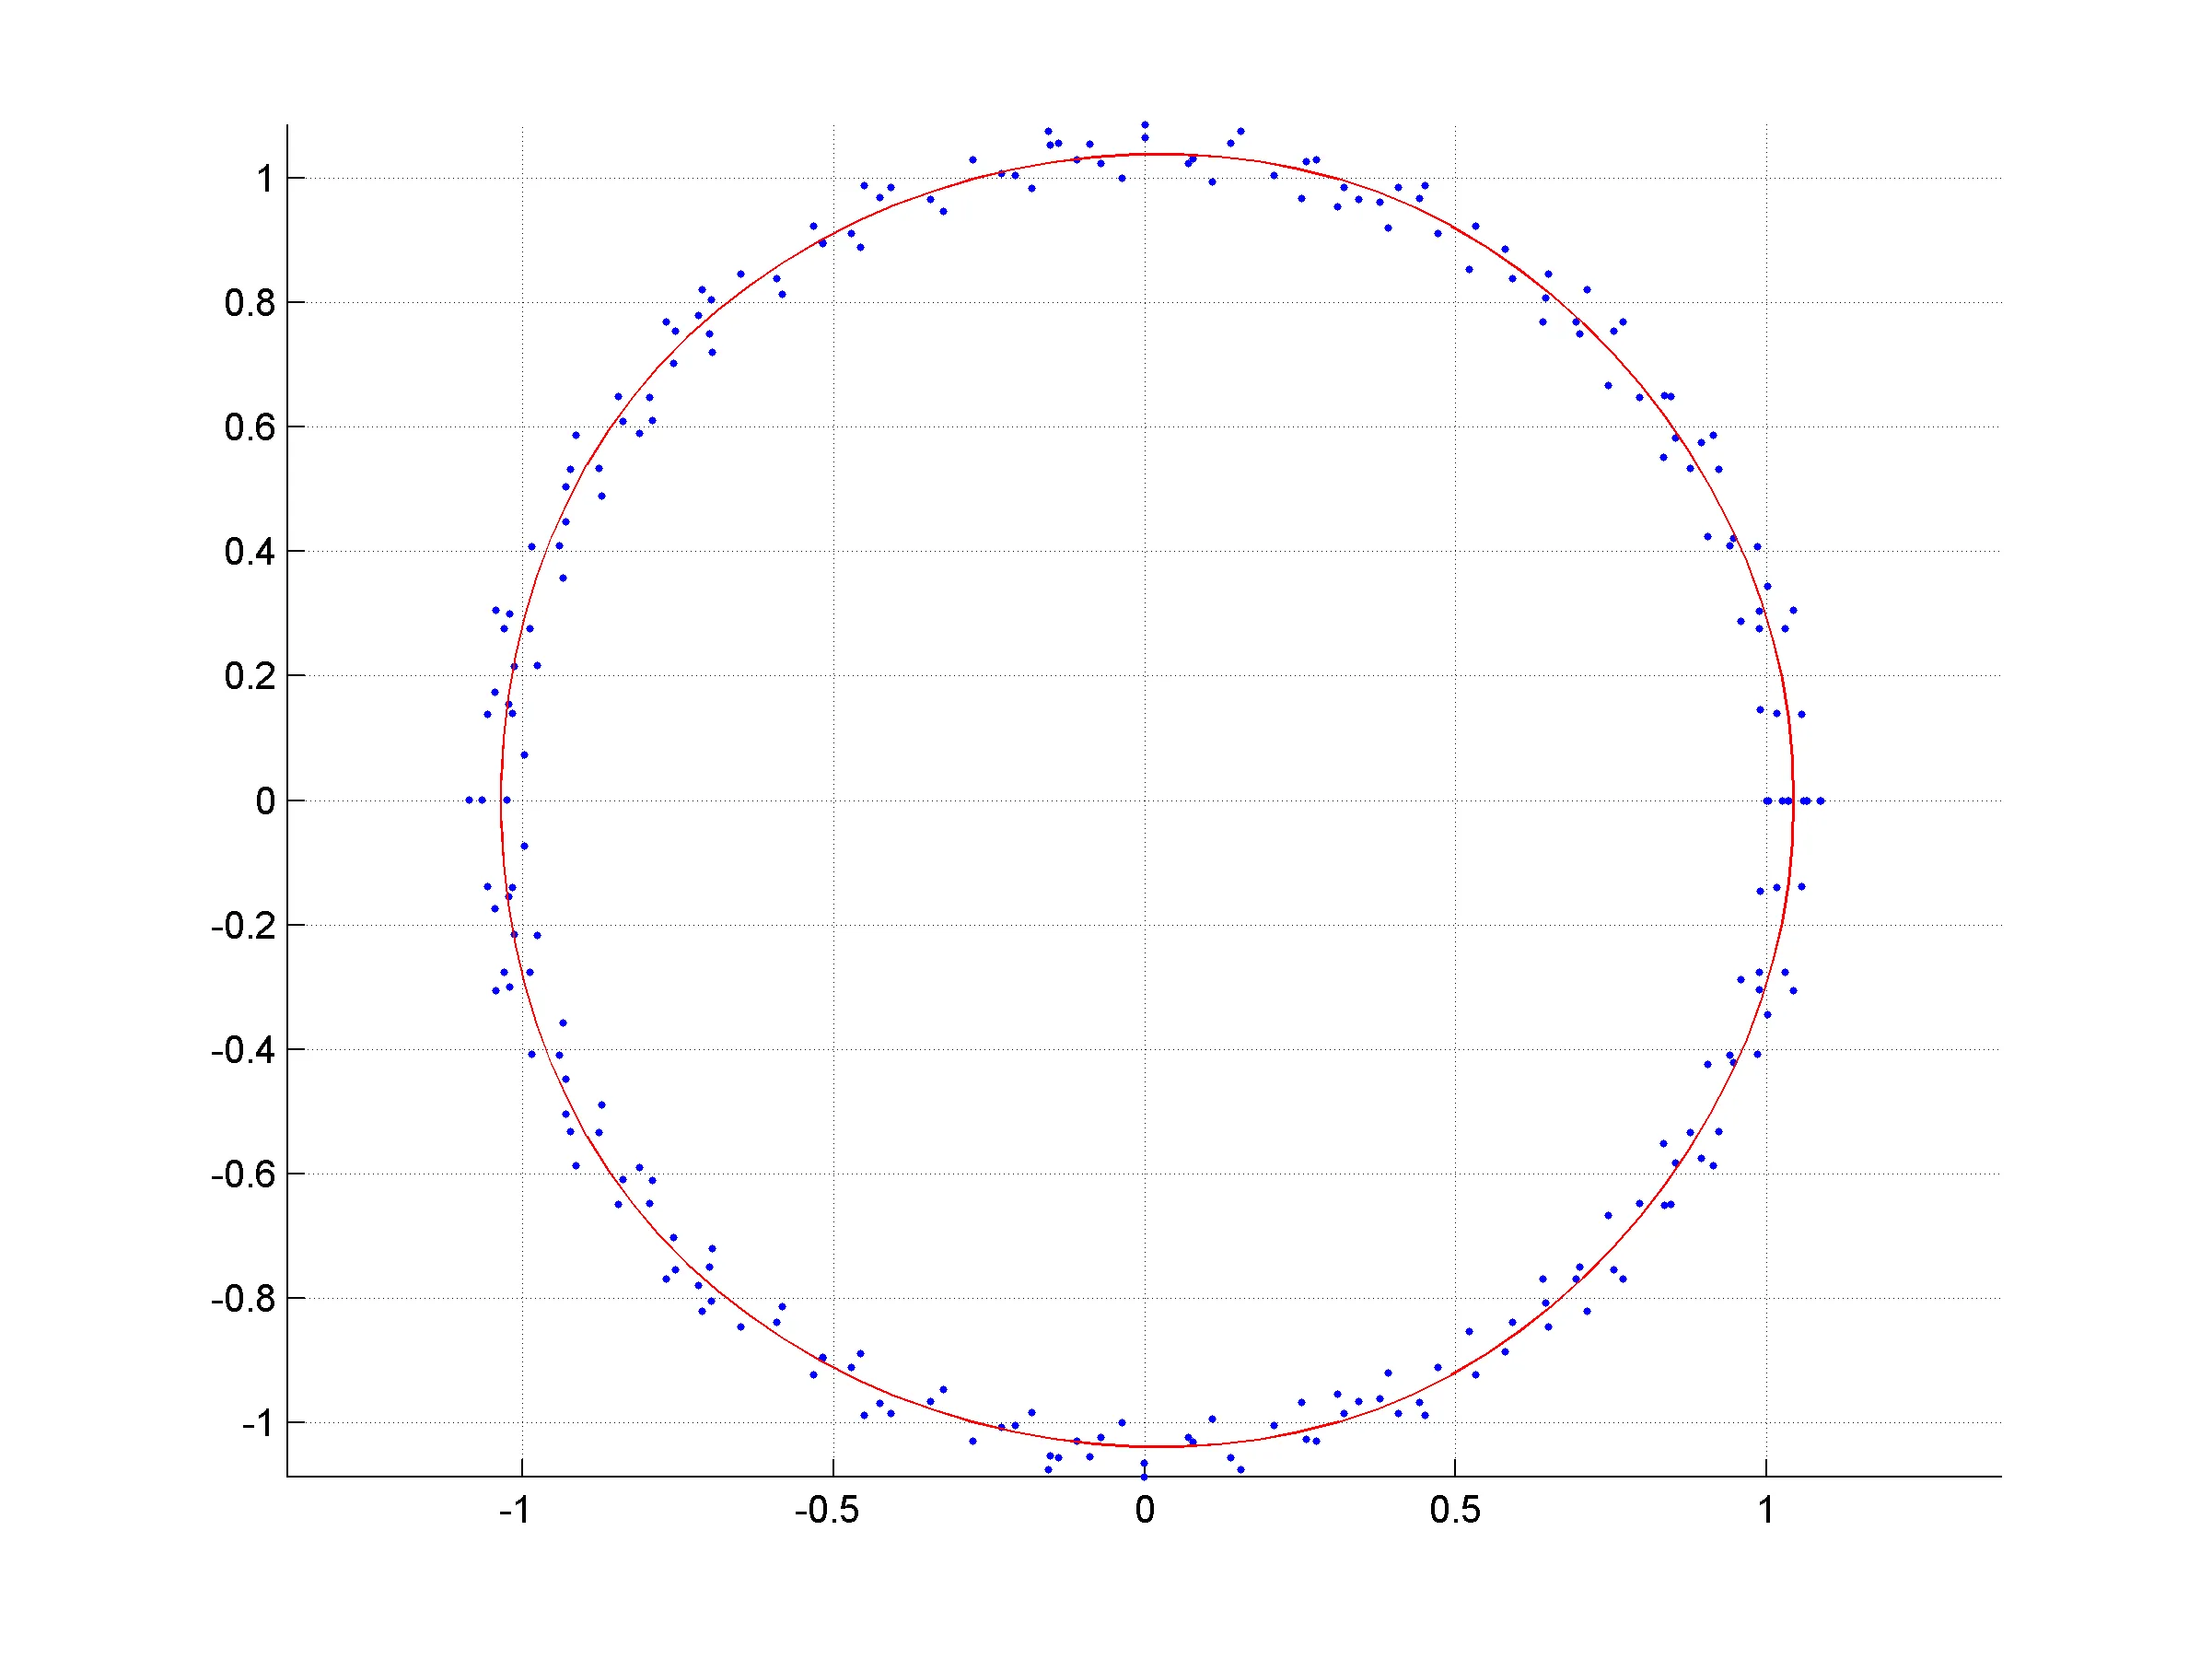
function spline_test
xx = [];
yy = [];
tt = [];
for iter = 1 : 10
nn = ceil(50 * rand(1))
TT = linspace(0.0, 2.0 * pi, nn)';
rtemp = 1.0 + 0.1 * rand(1);
xtemp = rtemp * cos(TT);
ytemp = rtemp * sin(TT);
ttemp = TT;
xx = [xx; xtemp];
yy = [yy; ytemp];
tt = [tt; ttemp];
end
ts = linspace(0.0, 2.0 * pi, 100);
sx = splinefit(tt, xx, 5, 'p');
sy = splinefit(tt, yy, 5, 'p');
xs = ppval(sx, ts);
ys = ppval(sy, ts);
figure; axis equal; grid on; hold on;
plot(xx, yy, 'b.');
plot(xs, ys, 'r-');
end
你的数据显然比这个更复杂,但这可能会让你有所启发。
希望这可以帮到你。
*.stl文件类型-一种用于三角形面的简单几何文件格式:http://en.wikipedia.org/wiki/STL_%28file_format%29。 - Darren Engwirda