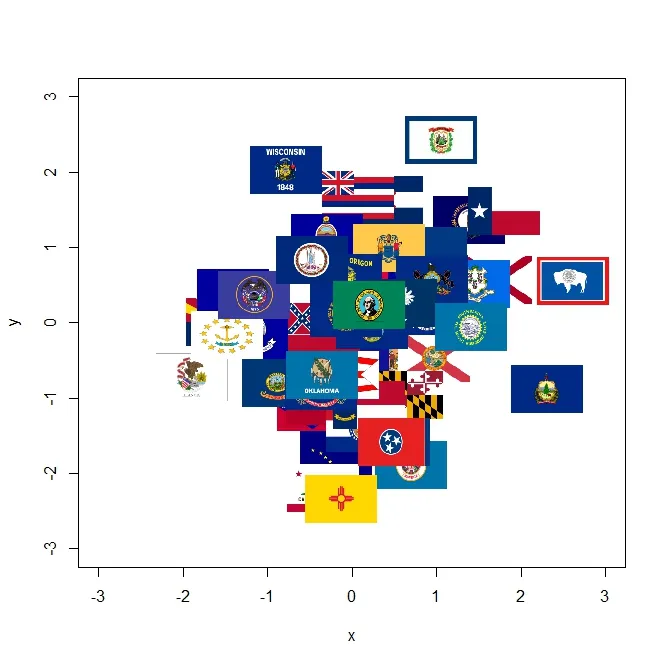
给定'n'个png/jpeg格式的图片和对应的二维坐标(x,y):我想在一个图中将这些图片绘制在给定的坐标上。如果我发现图片太大,我希望在给定的坐标上绘制一个更小/缩放版本的图片。如何在R中实现这样的图形?
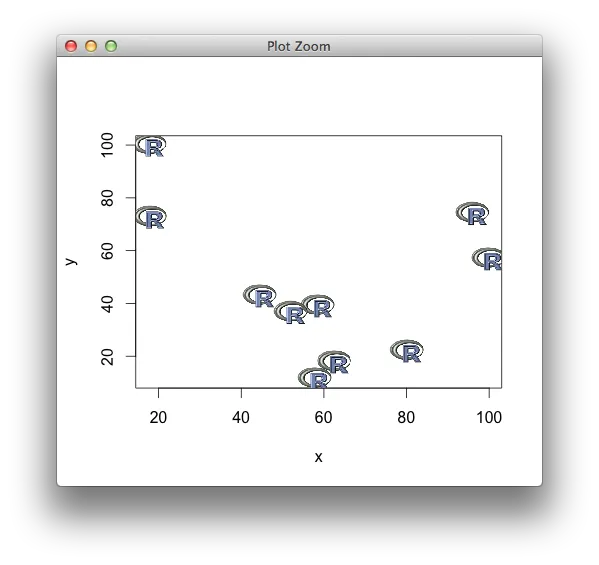
下面给出了这种图形的示例: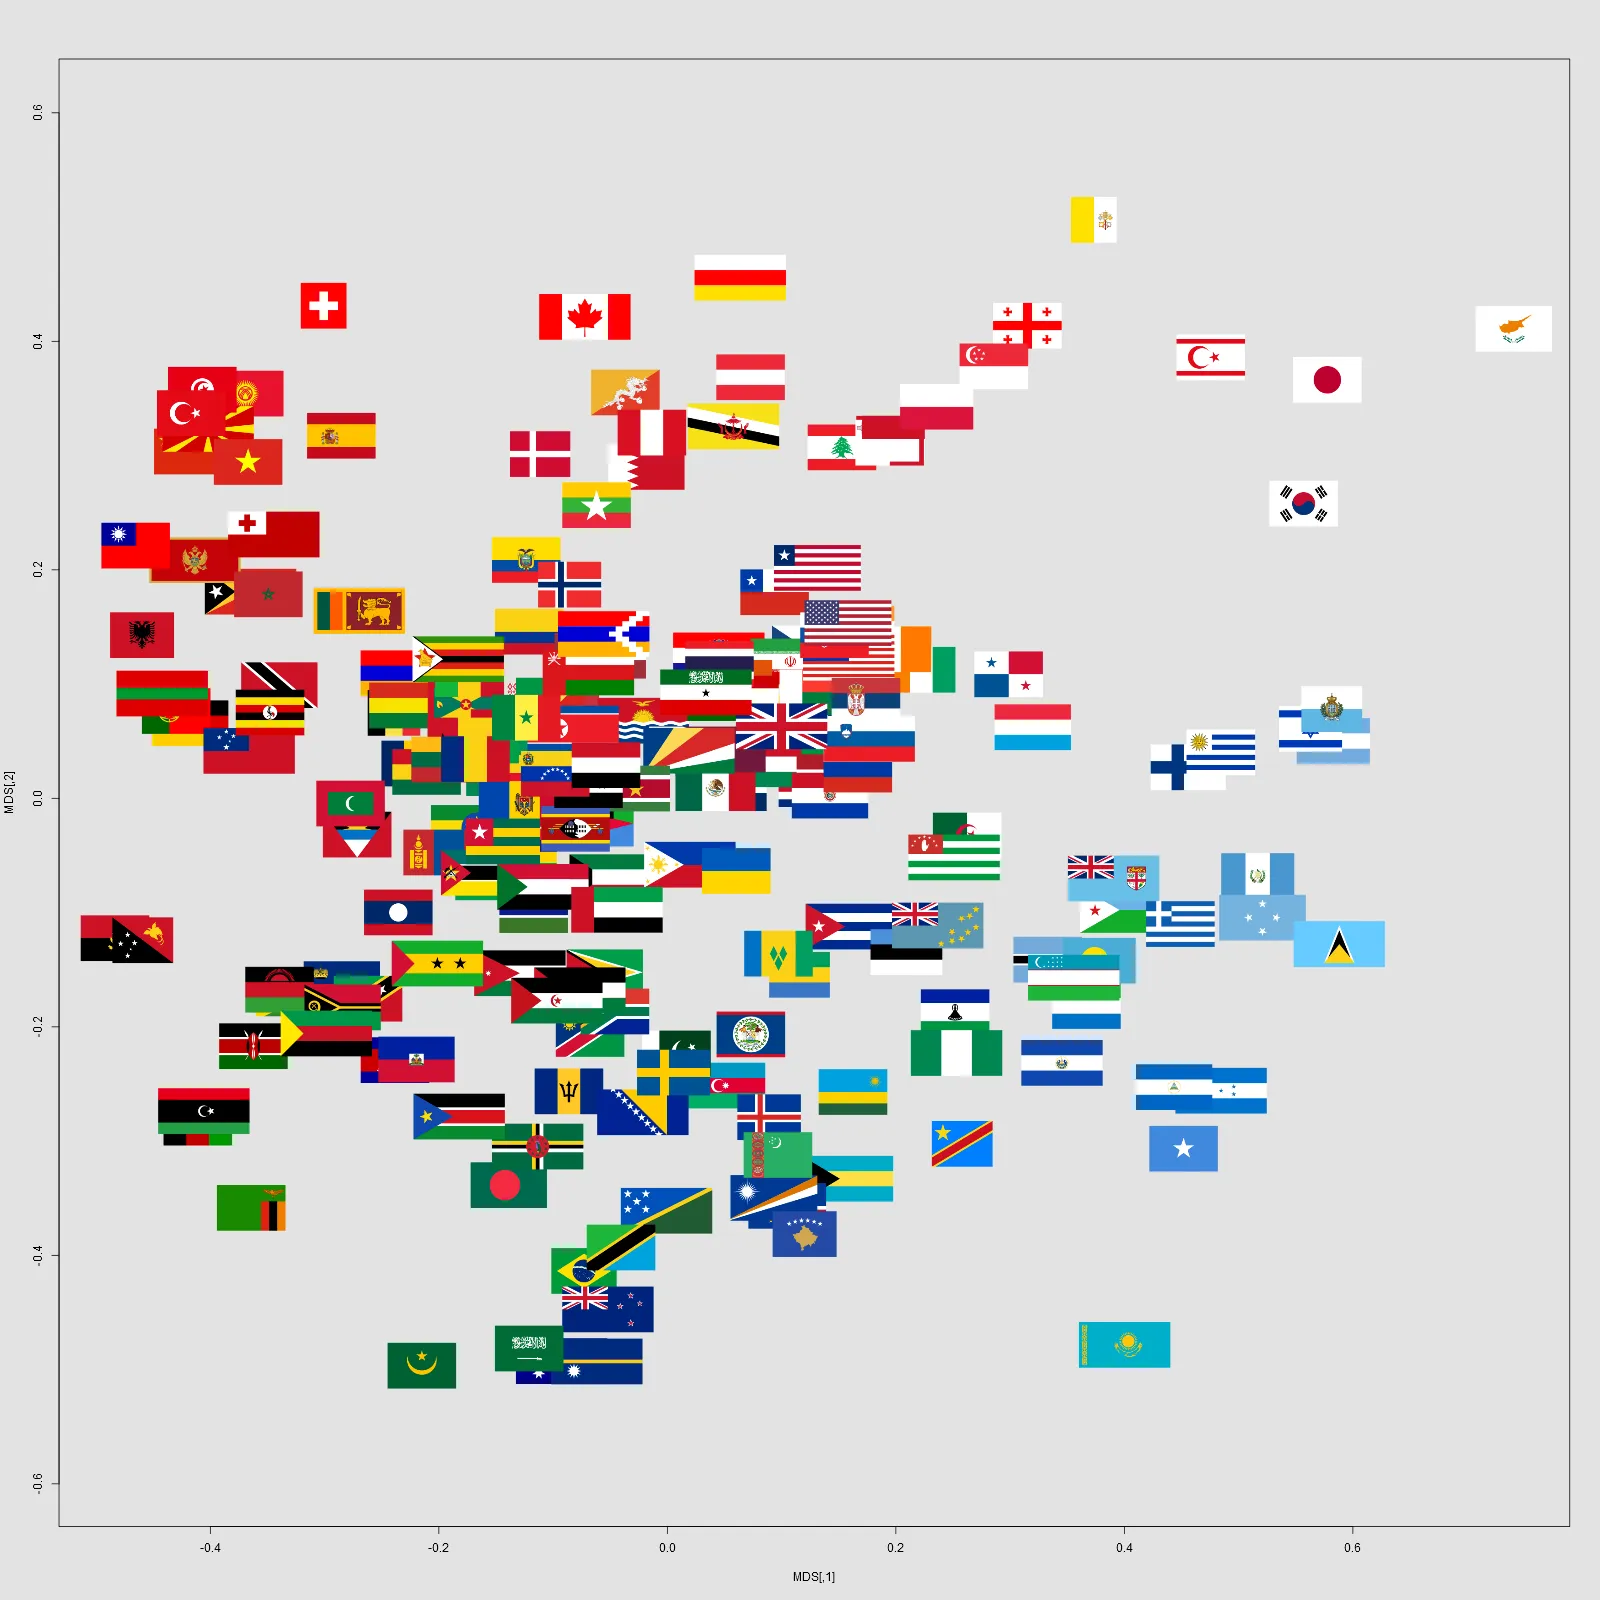
下面给出了这种图形的示例:
xy <- data.frame(x=runif(10, 0, 100), y=runif(10, 0, 100))

require(png)
img <- readPNG(system.file("img", "Rlogo.png", package="png"))

thumbnails <- function(x, y, images, width = 0.1*diff(range(x)),
                       height = 0.1*diff(range(y))){

  images <- replicate(length(x), images, simplify=FALSE)
  stopifnot(length(x) == length(y))

  for (ii in seq_along(x)){
    rasterImage(images[[ii]], xleft=x[ii] - 0.5*width,
                ybottom= y[ii] - 0.5*height,
                xright=x[ii] + 0.5*width,
                ytop= y[ii] + 0.5*height, interpolate=FALSE)
  }
}

plot(xy, t="n")
thumbnails(xy[,1], xy[,2], img)
TeachingDemos包中的my.symbols函数和ms.image函数可用于使用图像绘制图形。
以下是一个示例:
library(png)

flag.list <- lapply( list.files('flags/',pattern='png$', full=TRUE),
    function(x) readPNG(x) )

library(TeachingDemos)

ms.flags <- function(ind,...) {

    tmp <- array(0, dim=c(150,150,4) )
    tmp[ 26:125, , 1:3] <- flag.list[[ind]]
    tmp[ 26:125, , 4 ] <- 1

    ms.image(tmp,...)
}

x <- rnorm(50)
y <- rnorm(50)

my.symbols(x,y, symb = ms.flags, ind=1:50, symb.plots=TRUE,
  add=FALSE, xlim=c(-3,3), ylim=c(-3,3), inches=0.75)
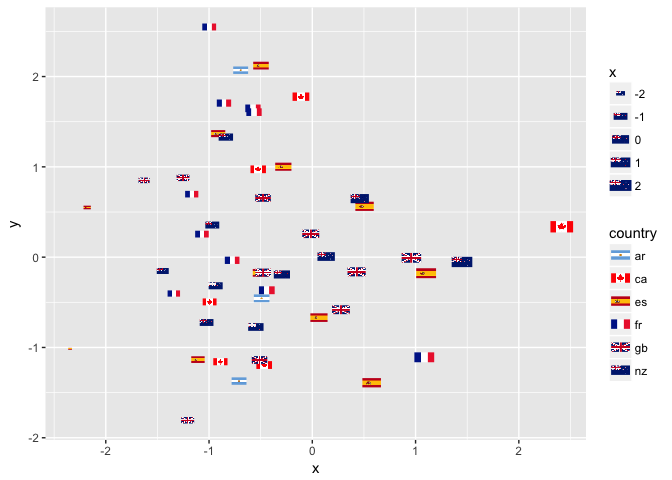
library(ggflags)
set.seed(1234)
d <- data.frame(x=rnorm(50), y=rnorm(50),
                country=sample(c("ar","fr", "nz", "gb", "es", "ca"), 50, TRUE),
                stringsAsFactors = FALSE)
ggplot(d, aes(x=x, y=y, country=country, size=x)) +
  geom_flag() +
  scale_country()