我加载了图片并尝试在其中绘制一个红点。
img=mpimg.imread('./images/im00001.jpg')
red = [0,0,255]
# Change one pixel
img[ 0.,-26.10911452,0. ]=red
imgplot = plt.imshow(img)
但出现了以下错误
ValueError: 赋值目标是只读的
我加载了图片并尝试在其中绘制一个红点。
img=mpimg.imread('./images/im00001.jpg')
red = [0,0,255]
# Change one pixel
img[ 0.,-26.10911452,0. ]=red
imgplot = plt.imshow(img)
但出现了以下错误
ValueError: 赋值目标是只读的
你所做的实际上会改变你的图像。
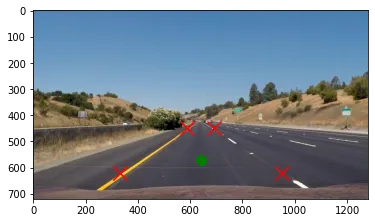
要在显示图像时绘制点,可以在 matplotlib 图中展示图像,然后在其上绘制点。你可以使用 pyplot.plot() 函数来绘制点,或者使用 pyplot.scatter() 函数来绘制一组点。
image = mpimg.imread("road.jpg")
pts = np.array([[330,620],[950,620],[692,450],[587,450]])

plt.imshow(image)
plt.plot(640, 570, "og", markersize=10)  # og:shorthand for green circle
plt.scatter(pts[:, 0], pts[:, 1], marker="x", color="red", s=200)
plt.show()
你已经在正确的轨道上了。你可以使用Numpy切片来更改像素的属性。
img[x,y] = [B,G,R]
(50,50)处的像素更改为红色,您可以执行以下操作:img[50,50] = [0,0,255]

import cv2
import numpy as np

width = 100
height = 100

# Make empty black image of size (100,100)
img = np.zeros((height, width, 3), np.uint8)

red = [0,0,255]

# Change pixel (50,50) to red
img[50,50] = red

cv2.imshow('img', img)
cv2.waitKey(0)
另一种方法是使用cv2.circle()在原位绘制您的点。
函数头如下:
cv2.circle(image, (x, y), radius, (B,G,R), thickness)
cv2.circle(img, (50,50), 1, red, -1)

pip install opencv-python来安装它。如果你决定使用matplotlib,请参考@arsho的优秀答案。 - nathancympimg 表示您正在使用 matplotlib 读取图像。
以下是使用 matplotlib 处理图像时需要记住的几点:
matplotlib 将图像数据存储到 Numpy 数组中。因此,type(img) 将返回 <class 'numpy.ndarray'>。(参考文献1)ndarray 的形状表示图像的高度、宽度和波段数。[1, 0, 0][1, 0, 0, 1]matplotlib 中,图形的大小是固定的,并且内容被拉伸/压缩/插值以适应图形。因此,在保存图像后,分辨率可能会发生变化。(参考文献2)根据这些要点,我编辑了一个 RGBA 图像(png 格式),在其中心放置了一个红点。
原始图像:

编辑后的图像:

code.py:
import numpy as np
import matplotlib.pyplot as plt
import matplotlib.image as mpimg

# dpi for the saved figure: https://dev59.com/I1sW5IYBdhLWcg3wm4YK#34769840
dpi = 80

# Set red pixel value for RGB image
red = [1, 0, 0]
img = mpimg.imread("minion.png")
height, width, bands = img.shape

# Update red pixel value for RGBA image
if bands == 4:
    red = [1, 0, 0, 1]

# Update figure size based on image size
figsize = width / float(dpi), height / float(dpi)

# Create a figure of the right size with one axes that takes up the full figure
figure = plt.figure(figsize=figsize)
axes = figure.add_axes([0, 0, 1, 1])

# Hide spines, ticks, etc.
axes.axis('off')

# Draw a red dot at pixel (62,62) to (66, 66)
for i in range(62, 67):
    for j in range(62, 67):
        img[i][j] = red

# Draw the image
axes.imshow(img, interpolation='nearest')

figure.savefig("test.png", dpi=dpi, transparent=True)
参考文献:
"Original Answer"翻译成“最初的回答”。
img是三维的,所以你正在将一个列表(img[0.,-26.10911452,0.])设置为你的三维数组的值。虽然我不知道为什么这会导致错误。另外可能无关紧要的是,你为什么要使用浮点数来索引你的数组? - busybear