我无法在不保留白边且以初始分辨率(1037x627)保存该图像。
import numpy as np
import matplotlib.pyplot as plt
from matplotlib import pyplot, lines
import matplotlib.image as mpimg
from matplotlib.patches import Ellipse
x=[0,0,0,0,0]
y=[0,0,0,0,0]
a=10**1.3*15
inc=25
b=np.cos(np.radians(inc))*a
x[0],y[0]=516.667,313.021
x[1],y[1]=x[0]-a,y[0]
x[2],y[2]=x[0]+a,y[0]
x[3],y[3]=x[0],y[0]+b
x[4],y[4]=x[0],y[0]-b
for pa in range(0,10,5):
    fig, ax = plt.subplots()
    img=mpimg.imread('IC342.png')
    imgplot = plt.imshow(img)
    x[1],y[1]=x[0]-a/2*np.cos(np.radians(pa)),y[0]-a/2*np.sin(np.radians(pa))
    x[2],y[2]=x[0]+a/2*np.cos(np.radians(pa)),y[0]+a/2*np.sin(np.radians(pa))
    x[3],y[3]=x[0]+b/2*np.cos(np.radians(pa+90)),y[0]+b/2*np.sin(np.radians(pa+90))
    x[4],y[4]=x[0]-b/2*np.cos(np.radians(pa+90)),y[0]-b/2*np.sin(np.radians(pa+90))
    ell = Ellipse(xy=[516.667,313.021], width=a, height=b, angle=pa, edgecolor='b',lw=4, alpha=0.5, facecolor='none')
    name='plt'+str(pa)+'.png'
    leg='PA='+str(pa)
    #ax.text(10, 10, leg, fontsize=15,color='white')
    ax.add_artist(ell)
    xn=[x[1],x[2],x[0]]
    yn=[y[1],y[2],y[0]]
    xnw=[x[3],x[4],x[0]]
    ynw=[y[3],y[4],y[0]]
    line = lines.Line2D(xn, yn, linestyle='-.',lw=5., color='r', alpha=0.4)
    line1 = lines.Line2D(xnw, ynw, linestyle='-.',lw=5., color='g', alpha=0.4)
    ax.add_line(line)
    ax.add_line(line1)
    plt.axis('off')
    fig.savefig(name, transparent=True, bbox_inches='tight', pad_inches=0,dpi=150 )
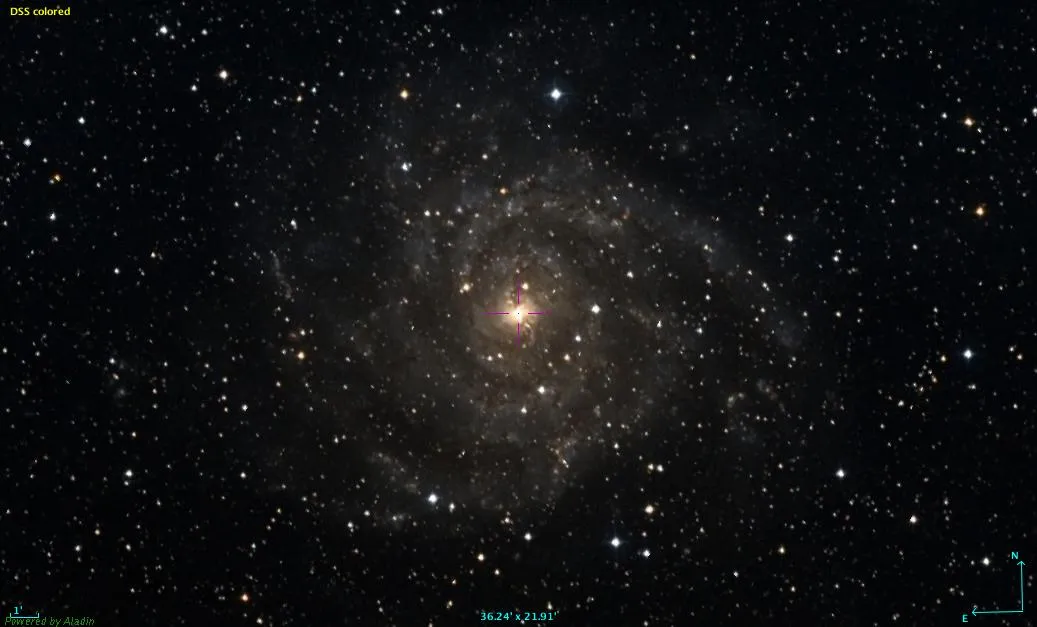
初始图片
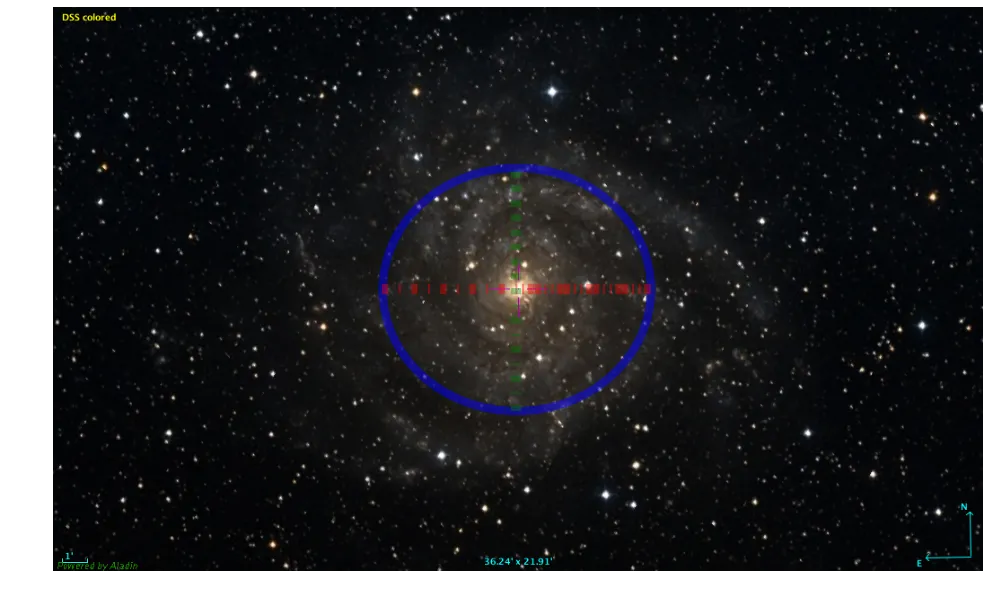
结果
同时,我需要白色文本PA=something显示在图片上,而不改变分辨率。据我所知,添加另一个类似文本的元素可能会自动更改分辨率。
感谢您的时间!