假设有这个函数
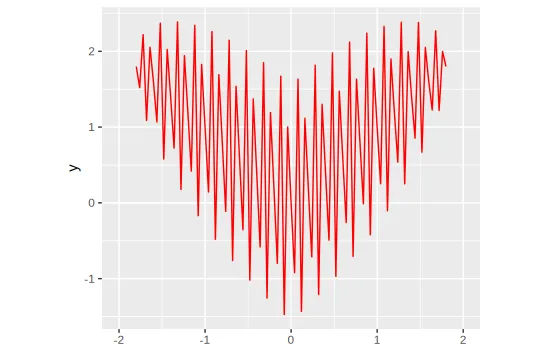
sqrt(x^2)+0.9*sqrt(3.3-x^2)*sin(30*pi*x),该函数生成一个心形的图形。

有没有使用 ggplot2 的方法来重现这个函数,以获得一个红色的 心形 作为输出?感谢您的帮助。
f <-  function(x) sqrt(x^2)+0.9*sqrt(3.3-x^2)*sin(30*(pi)*x)

ggplot() +
  xlim(-2, 2) +
  geom_function(fun = f, color="red") +
  theme(aspect.ratio=0.85)
另一个解决方案。这个方案包含函数的解析表达式。
library(ggplot2)

f <- function(x) abs(x)^(2/3)+0.9*sqrt(3.3-x^2)*sin(18*pi*x)

expr <- "y == abs(x)^frac(2, 3) + 0.9 * sqrt(3.3 - x^2) ~ sin(18 * pi * x)"

ggplot() +
  geom_function(fun = f, xlim = c(-sqrt(3.3), sqrt(3.3)), n = 1e4, color = "red") +
  annotate("text", x = 0, y = 3, colour = "white",
            label = expr,
            hjust = 0.5,
            parse = TRUE) +
  ylim(-2, 3.5) +
  theme(
    panel.background = element_rect(colour = "black", fill = "black"),
    panel.grid = element_blank(),
    aspect.ratio = 4/3
  )

由 reprex package (v2.0.1) 创建于2022年3月26日
如果您沿着预定义的序列直接计算,您将获得更好的分辨率。此外,该公式并不完全正确,因此我已经进行了修改:
heart <- function(x) abs(x)^(2/3) + 0.9 * sqrt(3.3 - x^2) * sin(18 * pi * x)

df <- data.frame(x = seq(-sqrt(3.3), sqrt(3.3), length = 3000),
                 y = heart(seq(-sqrt(3.3), sqrt(3.3), length = 3000)))


ggplot(df, aes(x, y)) +
  geom_line(size = 1, colour = "red") +
  scale_x_continuous(limits = c(-2, 2)) +
  coord_equal() +
  theme_void() +
  theme(plot.background = element_rect(fill = "#400000"))

sqrt(x^2)+0.9*sqrt(3.3-x^2)*sin(30*pi*x)
不是图片中的那一个。
应该是:
(x^2)^(1/3)+0.9*sqrt(3.3-x^2)*sin(30*pi*x)
即使用(x^2)的3次方根,而不是2次方根。
f(x)=x^(2/3)+0.85*(4-x^2)^(1/2)*sin(a*pi*x)
aspect.ratio!(迄今只知道coord_fixed())。 - user18309711