有没有办法在R中绘制具有更大边缘长度的图形?
我只是使用
library(igraph)
plot(graph)
是否有人知道为什么所有边缘的长度都不同?
**    V1    V2
1      6     1
2      6     5
3      1     0
4      1     6
5      1   385
6      5     4
7      5     6
8      5    98
9      0     1
10     0     2
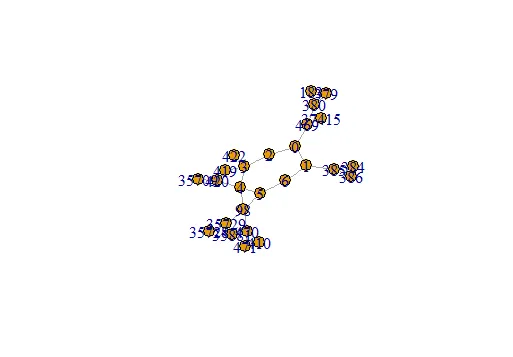
我有这种格式的数据,并正在生成网络图。