我们如何在R语言中绘制Highcharts组织结构图?

6
我们正在尝试使用R语言绘制https://www.highcharts.com/docs/chart-and-series-types/organization-chart的组织图表。
我们已经使用R的highcharter库构建了这个图表,但是我们无法将其开发到我们想要的程度。
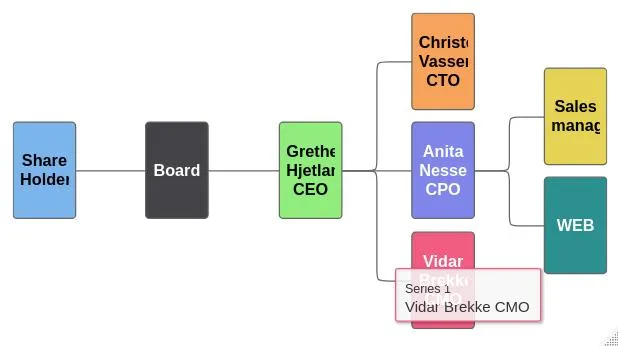
enter image description here
devtools::install_github("jbkunst/highcharter")
library(highcharter)
highchart() %>%
  hc_chart(type = 'organization') %>%
  hc_add_series(
    data = list(
    list(from = 'Share Holders', to = 'Board'),
      list(from = 'Board', to = 'Grethe Hjetland CEO'),
      list(from = 'Grethe Hjetland CEO', to = 'Christer Vasseng CTO'),
      list(from = 'Grethe Hjetland CEO', to = 'Anita Nesse CPO'),
      list(from = 'Grethe Hjetland CEO', to = 'Vidar Brekke CMO'),
      list(from = 'Anita Nesse CPO', to = 'Sales manager'),
      list(from = 'Anita Nesse CPO', to = 'WEB')
    ),color = 'red'
  )

我们想要的是...

enter image description here

这里是源代码 https://jsfiddle.net/gh/get/library/pure/highcharts/highcharts/tree/master/samples/highcharts/demo/organization-chart

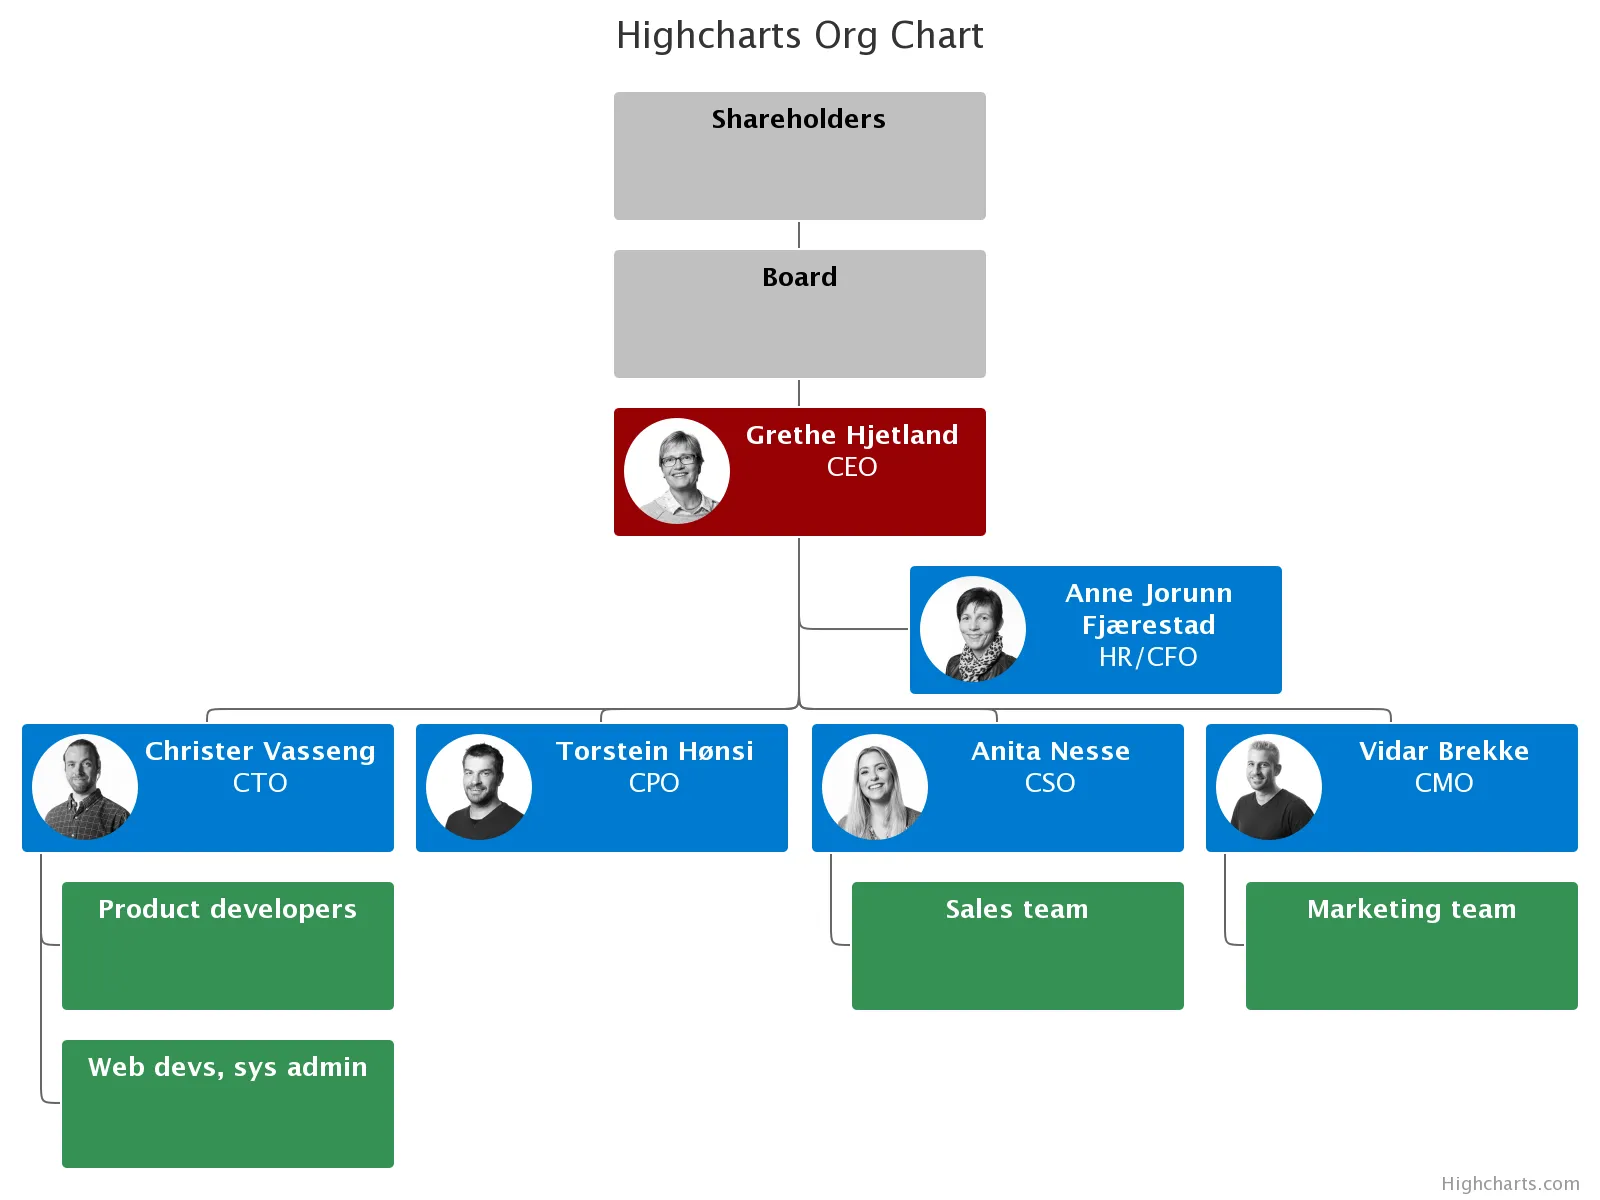
以下是JavaScript代码(您也可以在源代码中看到所有的Html Css和JavaScript)

Highcharts.chart('container', {
  chart: {
    height: 600,
    inverted: true
  },

  title: {
    text: 'Highcharts Org Chart'
  },

  accessibility: {
    point: {
      descriptionFormatter: function(point) {
        var nodeName = point.toNode.name,
          nodeId = point.toNode.id,
          nodeDesc = nodeName === nodeId ? nodeName : nodeName + ', ' + nodeId,
          parentDesc = point.fromNode.id;
        return point.index + '. ' + nodeDesc + ', reports to ' + parentDesc + '.';
      }
    }
  },

  series: [{
    type: 'organization',
    name: 'Highsoft',
    keys: ['from', 'to'],
    data: [
      ['Shareholders', 'Board'],
      ['Board', 'CEO'],
      ['CEO', 'CTO'],
      ['CEO', 'CPO'],
      ['CEO', 'CSO'],
      ['CEO', 'CMO'],
      ['CEO', 'HR'],
      ['CTO', 'Product'],
      ['CTO', 'Web'],
      ['CSO', 'Sales'],
      ['CMO', 'Market']
    ],
    levels: [{
      level: 0,
      color: 'silver',
      dataLabels: {
        color: 'black'
      },
      height: 25
    }, {
      level: 1,
      color: 'silver',
      dataLabels: {
        color: 'black'
      },
      height: 25
    }, {
      level: 2,
      color: '#980104'
    }, {
      level: 4,
      color: '#359154'
    }],
    nodes: [{
      id: 'Shareholders'
    }, {
      id: 'Board'
    }, {
      id: 'CEO',
      title: 'CEO',
      name: 'Grethe Hjetland',
      image: 'https://wp-assets.highcharts.com/www-highcharts-com/blog/wp-content/uploads/2018/11/12132317/Grethe.jpg'
    }, {
      id: 'HR',
      title: 'HR/CFO',
      name: 'Anne Jorunn Fjærestad',
      color: '#007ad0',
      image: 'https://wp-assets.highcharts.com/www-highcharts-com/blog/wp-content/uploads/2018/11/12132314/AnneJorunn.jpg',
      column: 3,
      offset: '75%'
    }, {
      id: 'CTO',
      title: 'CTO',
      name: 'Christer Vasseng',
      column: 4,
      image: 'https://wp-assets.highcharts.com/www-highcharts-com/blog/wp-content/uploads/2018/11/12140620/Christer.jpg',
      layout: 'hanging'
    }, {
      id: 'CPO',
      title: 'CPO',
      name: 'Torstein Hønsi',
      column: 4,
      image: 'https://wp-assets.highcharts.com/www-highcharts-com/blog/wp-content/uploads/2018/11/12131849/Torstein1.jpg'
    }, {
      id: 'CSO',
      title: 'CSO',
      name: 'Anita Nesse',
      column: 4,
      image: 'https://wp-assets.highcharts.com/www-highcharts-com/blog/wp-content/uploads/2018/11/12132313/Anita.jpg',
      layout: 'hanging'
    }, {
      id: 'CMO',
      title: 'CMO',
      name: 'Vidar Brekke',
      column: 4,
      image: 'https://wp-assets.highcharts.com/www-highcharts-com/blog/wp-content/uploads/2018/11/13105551/Vidar.jpg',
      layout: 'hanging'
    }, {
      id: 'Product',
      name: 'Product developers'
    }, {
      id: 'Web',
      name: 'Web devs, sys admin'
    }, {
      id: 'Sales',
      name: 'Sales team'
    }, {
      id: 'Market',
      name: 'Marketing team'
    }],
    colorByPoint: false,
    color: '#007ad0',
    dataLabels: {
      color: 'white'
    },
    borderColor: 'white',
    nodeWidth: 65
  }],
  tooltip: {
    outside: true
  },
  exporting: {
    allowHTML: true,
    sourceWidth: 800,
    sourceHeight: 600
  }

});

有人能帮我们用R语言绘制这个组织结构图吗?或者在R中运行JavaScript代码以获取此图表吗? 先行致谢!


1
这个回答解决了您的问题吗?如何使用highcharter构建组织图表 - raf18seb
1
不,我已经使用了这段代码,你可以在我的帖子中看到这段代码的输出。实际上,我想将这个图形开发到第二张图片(第二张图片是用JavaScript开发的)。你有任何想法如何做到吗? - Nurlan Imanov
1个回答

9

这里有一个示例代码:

library(highcharter)

highchart() %>%
  hc_chart(type = 'organization', inverted = TRUE) %>%
  hc_title(text = 'Highcharts Org Chart') %>%
  hc_add_series(
    name = 'Highsoft',
    data = list(
      list(from = 'Shareholders', to = 'Board'),
      list(from = 'Board', to = 'CEO'),
      list(from = 'CEO', to = 'CTO'),
      list(from = 'CEO', to = 'CPO'),
      list(from = 'CEO', to = 'CSO'),
      list(from = 'CEO', to = 'CMO'),
      list(from = 'CEO', to = 'HR'),
      list(from = 'CTO', to = 'Product'),
      list(from = 'CTO', to = 'Web'),
      list(from = 'CSO', to = 'Sales'),
      list(from = 'CMO', to = 'Market')
    ),
    levels = list(
      list(level = 0, color = 'silver', dataLabels = list(color = 'black'), height = 55),
      list(level = 1, color = 'silver', dataLabels = list(color = 'black'), height = 55),
      list(level = 2, color = '#980104'),
      list(level = 4, color = '#359154')
    ),
    nodes = list(
      list(id = 'Shareholders'),
      list(id = 'Board'),
      list(id = 'CEO', title = 'CEO', name = 'Grethe Hjetland', image = 'https://wp-assets.highcharts.com/www-highcharts-com/blog/wp-content/uploads/2018/11/12132317/Grethe.jpg'),
      list(id = 'HR', title = 'HR/CFO', name = 'Anne Jorunn Fjarestad', color = '#007ad0', image = 'https://wp-assets.highcharts.com/www-highcharts-com/blog/wp-content/uploads/2018/11/12132314/AnneJorunn.jpg', column = 3, offset = '75%'),
      list(id = 'CTO', title = 'CTO', name = 'Christer Vasseng', color = '#007ad0', image = 'https://wp-assets.highcharts.com/www-highcharts-com/blog/wp-content/uploads/2018/11/12140620/Christer.jpg', column = 4, layout = 'hanging'),
      list(id = 'CPO', title = 'CPO', name = 'Torstein Honsi', image = 'https://wp-assets.highcharts.com/www-highcharts-com/blog/wp-content/uploads/2018/11/12131849/Torstein1.jpg', column = 4),
      list(id = 'CSO', title = 'CSO', name = 'Anita Nesse', image = 'https://wp-assets.highcharts.com/www-highcharts-com/blog/wp-content/uploads/2018/11/12132313/Anita.jpg', column = 4, layout = 'hanging'),
      list(id = 'CMO', title = 'CMO', name = 'Vidar Brekke', image = 'https://wp-assets.highcharts.com/www-highcharts-com/blog/wp-content/uploads/2018/11/13105551/Vidar.jpg', column = 4, layout = 'hanging'),
      list(id = 'Product', name = 'Product developers'),
      list(id = 'Web', name = 'Web devs, sys admin'),
      list(id = 'Sales', name = 'Sales team'),
      list(id = 'Market', name = 'Marketing team')
    ),
    colorByPoint = TRUE,
    color = '#007ad0',
    dataLabels = list(color = 'white'),
    borderColor = 'white',
    nodeWidth = 65
  ) %>%
  hc_tooltip(outside = TRUE)
您可以看到R结构。如果您想在其中使用JavaScript代码,可以使用JS()方法。更多使用JS()方法的Highcharts在R中的示例可以在我的StackOverflow个人资料的“Answers”选项卡中找到。
如有进一步问题,请告诉我。
编辑:一些属性(例如颜色)在Highcharter包装器中不起作用。我建议在Highcharter repo上创建一个GitHub工单:https://github.com/jbkunst/highcharter/issues 。也许包装器的作者会知道更多信息。

谢谢,这非常有帮助!我尝试使用存储在计算机上的人物图像(JPG格式),但没有成功。是否有可能使其工作,或者这些图像必须在线上才行? - NicolasH2
@raf18seb 你的等级列表规则是什么?似乎代码没有问题,返回相同的图表。 - VincentP
抱歉,我不明白你的问题,请再问一遍好吗?你是在询问“levels”列表吗?你可以在API中找到详细信息:https://api.highcharts.com/highcharts/series.organization.levels - raf18seb

网页内容由stack overflow 提供, 点击上面的
可以查看英文原文,
原文链接