如何在r语言中制作图表?

9

这是我的数据框:

df:

Country          Total       lon        lat
United Kingdom   5000       -3.43597    55.37805
China            4000       104.1954    35.86166
France           4000       2.213749    46.22764
Australia        4500       133.7751    -25.2744
Mexico           0          -102.553    23.6345

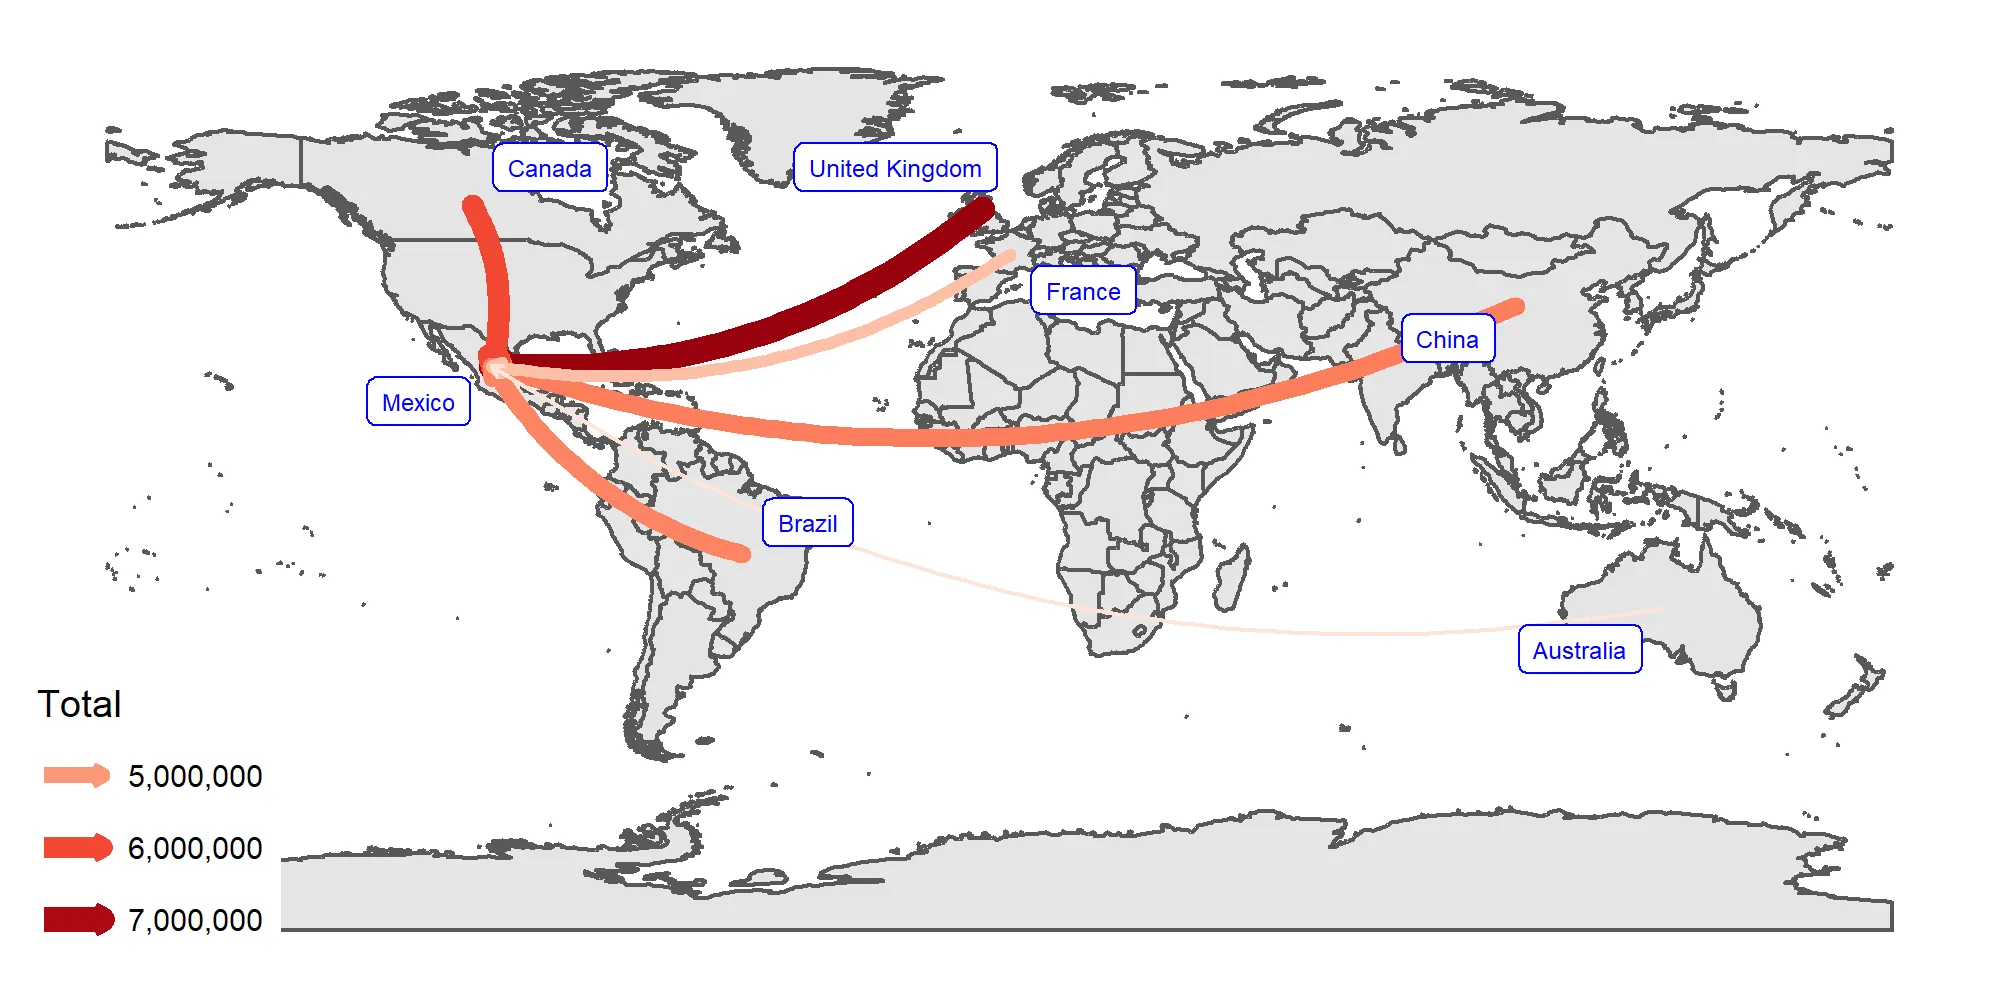
我刚开始学习R语言。我试图制作一张地图,展示不同国家到达墨西哥的旅行路线。由于目的地是墨西哥,所以所有的数据流都只会是单向的。我不知道如何在各个国家之间建立联系。我已经使用以下代码创建了一个布局:


world <- ne_countries(scale = "medium", returnclass = "sf")
class(world)
new_df <- read.csv('df.csv')
ggrepel::geom_label_repel

ggplot(data = world) +
  geom_sf()+geom_point(data=new_df, aes(x=lon, y=lat), colour='red')+
  ggrepel::geom_label_repel(data = new_df, 
                            aes(x = lon, y = lat), 
                            label = new_df$Country,
                            size = 2,
                            col = "blue")

一个很好的起点 https://github.com/rafapereirabr/flow-map-in-r-ggplot - M.Viking
1个回答

6

您可以使用 geom_curve 函数并使用 size 参数。您还可以使用 color 来增加对比度:

new_df <- new_df %>% 
  mutate(Total = as.numeric(gsub(",", "", Total)),
         lon2 = lon[Country == "Mexico"],
         lat2 = lat[Country == "Mexico"])
#          Country   Total         lon       lat     lon2    lat2
# 1 United Kingdom 7200000   -3.435970  55.37805 -102.553 23.6345
# 2          China 5359000  104.195400  35.86166 -102.553 23.6345
# 3         Canada 6016000 -106.347000  56.13037 -102.553 23.6345
# 4         Brazil 5269000  -51.925300 -14.23500 -102.553 23.6345
# 5         France 4484000    2.213749  46.22764 -102.553 23.6345
# 6      Australia 4014000  133.775100 -25.27440 -102.553 23.6345
# 7         Mexico       0 -102.553000  23.63450 -102.553 23.6345   


ggplot(data = world) +
  geom_sf() + 
  geom_curve(data = new_df[-7, ], 
             aes(x = lon, y = lat, xend = lon2, yend = lat2, size = Total, color = Total),
             curvature = -0.2, 
             lineend = "round",
             arrow = arrow(length = unit(0.1, "cm"))) +
  scale_size(range = c(.5, 3), label = scales::comma) +
  scale_color_distiller(label = scales::comma, 
                        palette = "Reds", 
                        direction = 1) +
  guides(color = guide_legend(), 
         size = guide_legend()) +
  ggrepel::geom_label_repel(data = new_df, aes(x = lon, y = lat), 
                            label = new_df$Country, size = 2, col = "blue") +
  ggthemes::theme_map()

在此输入图片描述


数据

new_df <- read.table(header = T, text = "Country          Total       lon        lat
'United Kingdom'   7,200,000   -3.43597   55.37805
China            5,359,000   104.1954   35.86166
Canada           6,016,000   -106.347   56.13037
Brazil           5,269,000   -51.9253   -14.235
France           4,484,000   2.213749   46.22764
Australia        4,014,000   133.7751   -25.2744
Mexico           0           -102.553   23.6345")

这很漂亮。我有一个不太相关的问题。你是如何从剪贴板复制数据框的?你使用了datapasta吗? - LDT
2
datapasta是一个不错的选择,但我猜我还是会用老式的方法,使用read.table和简单的复制粘贴。当它不起作用时,通常是因为这种方法无法处理带有空格的字符串,所以必须手动添加引号(例如这里的United Kingdom)。我编辑了问题以包括data.frame(您可以看到我如何检索它)。 - Maël

网页内容由stack overflow 提供, 点击上面的
可以查看英文原文,
原文链接