我已经搜索了很多关于我的具体问题,但是找不到解决方案。虽然我认为这很容易解决,但我对r语言还很陌生。
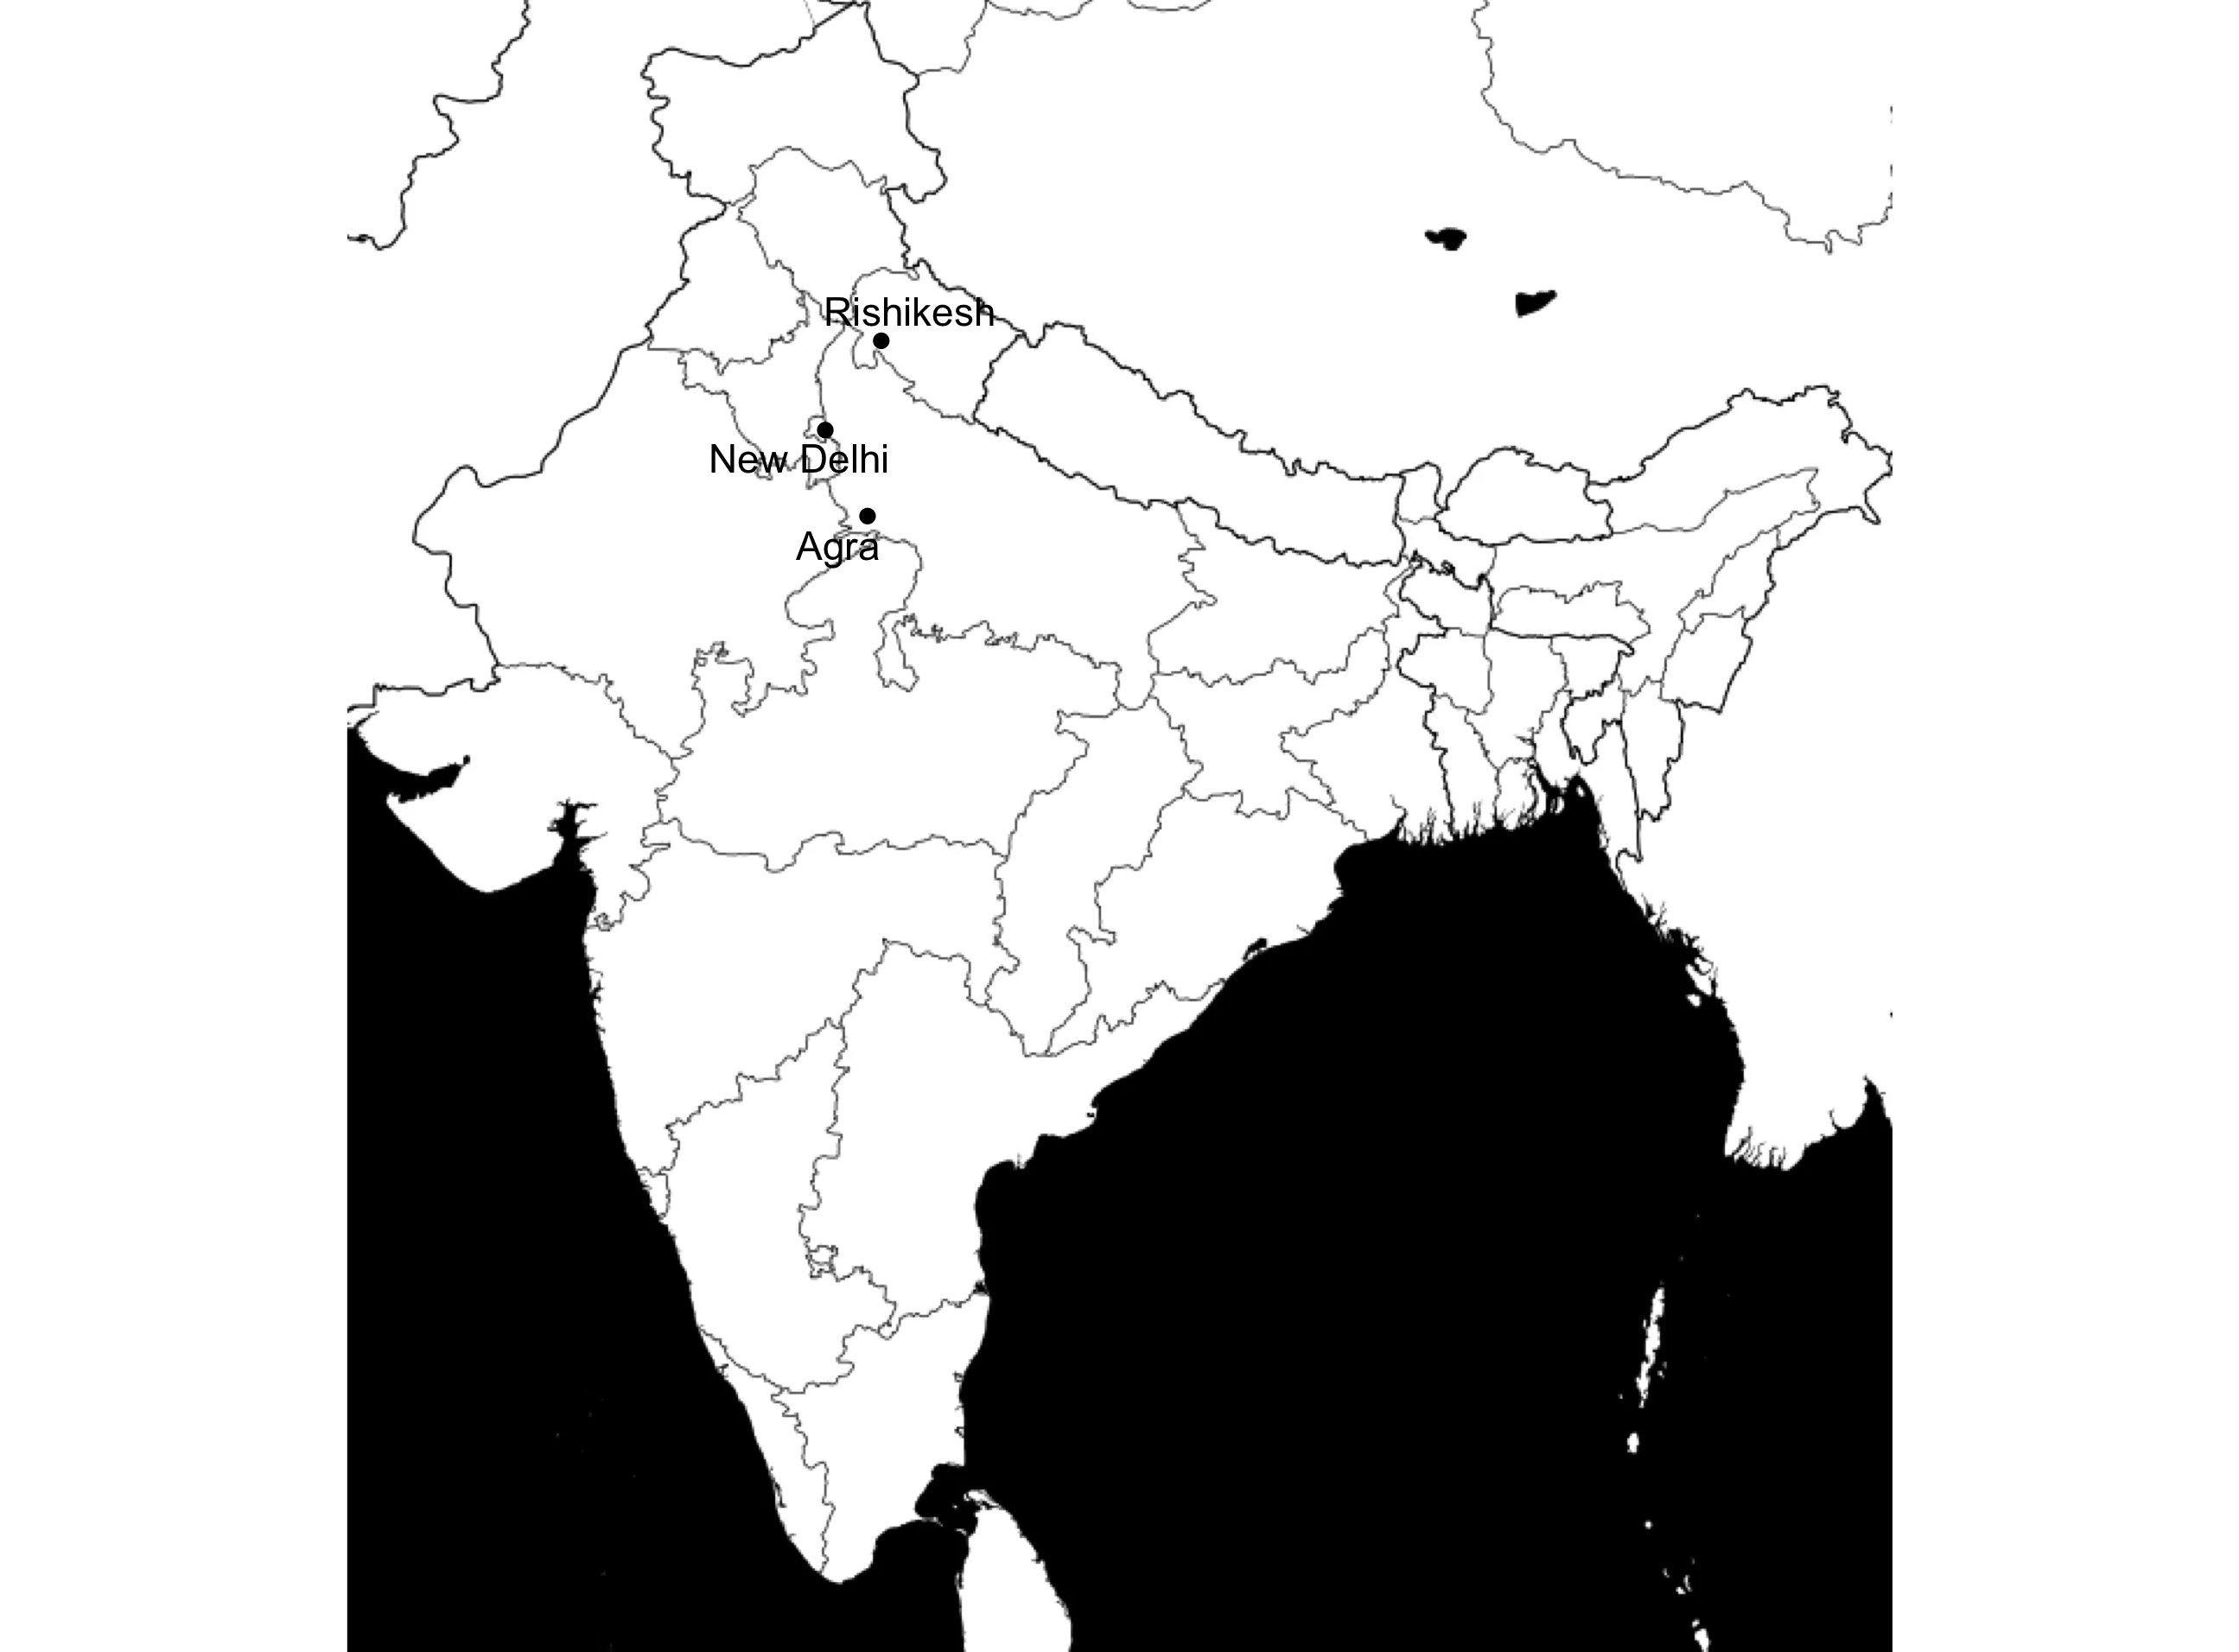
- What i want to do: I would like to plot a map of India held in black and white. And I want to plot all the places I visited with dots and the corresponding name. I managed to do all that with the code below.
My problem: How can I write the code in a simpler way for plotting the visited places? I don't want to create all the variables like
visit.xandvisit.y. Further, I would have to write for every place the code forgeom_pointandgeom_text. When I tried to plot more than one place at once with e.g.visited <- c("New Delhi", "Rishikesh")
然后我收到了错误信息“美学必须是长度为1或与数据相同的长度”。
My question: How can I just store all the visited places in one variable and plot it in one run? Like that I just need one line for
geom_pointand not for every place I want to plot.#Load required packages library(maps) library(ggmap) library(ggplot2) #Dataframe with country relevant information map <- fortify(map(fill = T, plot = F, region = "India")) #Places I want to mark on the map visited <- c("New Delhi") visited2 <- c("Rishikesh") visited3 <- c("Agra") #Extracting long / lat of the places visit.x <- geocode(visited)$lon visit.y <- geocode(visited)$lat visit.x2 <- geocode(visited2)$lon visit.y2 <- geocode(visited2)$lat visit.x3 <- geocode(visited3)$lon visit.y3 <- geocode(visited3)$lat #Defining font font = c("Courier") font.size = 3 #Specifing the look of the map with ggplot2 map_india <- ggplot(data = map, aes(x = long, y = lat, group = group)) + geom_polygon(fill = "white") + geom_path(colour = "black") + theme(panel.background = element_rect(fill = "#000000"), panel.grid.major = element_blank(), panel.grid.minor = element_blank(), axis.ticks = element_blank(), axis.text.y = element_blank(), axis.text.x = element_blank(), axis.title.x = element_blank(), axis.title.y = element_blank()) #Plotting the places I want on the map with labels map_india <- map_india + geom_point(aes(x = visit.x, y = visit.y)) + geom_text(data = NULL, x = visit.x - 1, y = visit.y + 0.2, label = "New Delhi", size = font.size, family = font) + geom_point(aes(x = visit.x2, y = visit.y2)) + geom_text(data = NULL, x = visit.x2 - 1, y = visit.y2 + 0.2, label = "Rishikesh", size = font.size, family = font) + geom_point(aes(x = visit.x3, y = visit.y3)) + geom_text(data = NULL, x = visit.x3, y = visit.y3 + 0.5, label = "Agra", size = font.size, family = font) + coord_fixed(0.8) #Creating pdf pdf("India.pdf", height = 11.69, width = 16.53) print(map_india) dev.off()
data(而不是现在的NULL),然后使用列名作为x、y和label。最好通过运行ggplot2示例并更好地学习它。虽然最终对于图表来说这是一种逻辑和直接的方法,但需要进行一些试验和错误才能到达那里。请记住ggplot2几何对象:heart:数据框。 - hrbrmstr