在R中在谷歌地图上绘制多个点的坐标

3

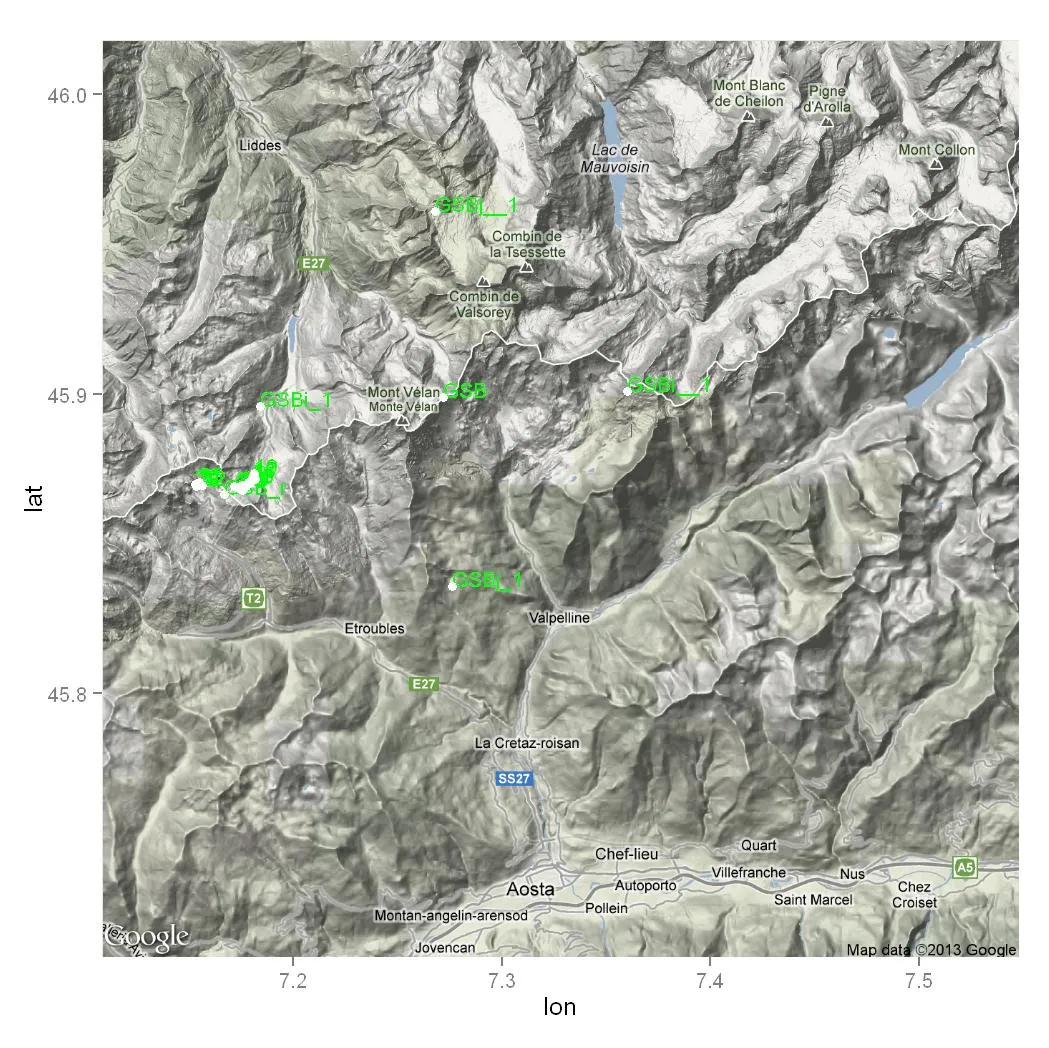
我希望在Google地图上绘制坐标,并显示点的ID:

数据样例:

          coordinates      id      
1   (7.1735, 45.8688)       2    
2  (7.17254, 45.8689)       3     
3  (7.17164, 45.8692)       4    
4  (7.18018, 45.8716)       5    
5  (7.17807, 45.8701)       6     
6  (7.17723, 45.8692)       7    
7  (7.17524, 45.8681)       8     
8  (7.18141, 45.8718)       9     
9   (7.1793, 45.8702)      10     
10 (7.17836, 45.8707)      11     
11 (7.17519, 45.8697)      12     
12 (7.17938, 45.8708)      13     
13 (7.17551, 45.8693)      14    
14 (7.17684, 45.8694)      15     
15 (7.18099, 45.8726)      17     
16 (7.18015, 45.8725)      18     
17 (7.18122, 45.8736)      19     
18 (7.17491, 45.8692)      20     
19 (7.15497, 45.8706)      25    
20  (7.1534, 45.8695)      28     
21 (7.15265, 45.8699)      29    
22   (7.15442, 45.87)      31    
23  (7.1561, 45.8698)      32     
24    (7.184, 45.896)  GSBi_1  
25     (7.36, 45.901) GSBi__1  
26    (7.268, 45.961) GSBj__1  
27    (7.276, 45.836)  GSBj_1 
28    (7.272, 45.899)     GSB  
29 (7.16667, 45.8667)   GSB_r  

那么,你有什么问题? - keune
@keune 我不知道如何自动获取Google地图上点的绘图。 - A.Amidi
你看过这个吗 https://dev59.com/gmrXa4cB1Zd3GeqPEfNc#13421322? - MattBagg
@MattBagg,是的,但我无法将带有标签的坐标添加到地图上。我从谷歌地图中检索到了地图[map <- get_map(location = 'Switzerland', zoom = 10, maptype = "terrain", source = "google")],但我不知道如何在地图上添加带有标签的坐标。 - A.Amidi
2
你能在地图上绘制点并只需要标签吗?我建议你编辑问题以包括你目前拥有的代码。 - MattBagg
2个回答

8

与其从Google请求“Switzerland”的地图,您应该通过指定经度/纬度和所需的缩放比例(以及可能的比例尺)来请求特定位置的地图。这样您就不必使用 coord_map() 然后模糊您的图像。

以下是基础知识,您可以像在任何 ggplot 中一样玩弄颜色和大小:

library(ggplot2)
library(ggmap)

# copying text off screen
# since the OP did not use dput()
data<-read.table("clipboard")

# reformat
data=data[,-1]
names(data)=c("lon","lat","id")
data$lon <- as.numeric(gsub('[\\(\\)\\,]', '', data$lon))
data$lat <- as.numeric(gsub('[\\(\\)\\,]', '', data$lat))

head(data)
#       lon     lat id   
# 1 7.17350 45.8688  2  
# 2 7.17254 45.8689  3 
# 3 7.17164 45.8692  4 
# etc

# determine a reasonable center for map, 
# this could fail in some places (near poles, 180th meridian)
# also google appears to shift things slightly
 center = paste(min(data$lat)+(max(data$lat)-min(data$lat))/2,
                min(data$lon)+(max(data$lon)-min(data$lon))/2, sep=" ")

# get map image from google
map <- get_map(location = center, zoom = 11, maptype = "terrain", 
       source = "google")

# start a ggplot. it won't plot til we type p
p <- ggmap(map)

# add text labels, these will overlap
p <- p + geom_text(data=data,aes(x = lon, y = lat, 
         label = id),
         colour="white",size=4,hjust=0, vjust=0)+
    theme(legend.position = "none") 

# add points last so they are on top
p <- p + geom_point(data=data,aes(x=lon, y=lat),colour="white",size=2)

# display plot
p 

这里输入图片描述

这自然地在?get_map?get_googlemap中描述。


我在最后一个图中遇到了一个错误,错误信息如下:不知道如何自动选择类型为standardGeneric的对象的比例。默认为连续比例。数据框架中的参数暗示了不同数量的行:29, 0。 - A.Amidi
没有查看你的代码和数据,很难说是什么原因导致了那个问题。sessionInfo() 显示的 ggplot2 版本是什么?如果你对数据框运行 str() 函数,里面的数据类型是什么? - MattBagg
抱歉,我犯了一个错误。版本是ggplot2_0.9.3和“数据框”:1个变量的29个obs。 $ id.X.y.z: chr "2,7.1735,45.86880001,0" "3,7.17254,45.86887001,0" "4,7.171636,45.86923601,0" "5,7.18018,45.87158001,0" ... - A.Amidi
你的所有数据都存储在一个字符串变量中的单个列中。你需要将每个变量分别存储为数字。你应该重新编写加载/获取数据的方法以正确解析它(或者,不太理想的是,使用as.numeric()和strsplit()的组合来创建数值型的单独变量)。 - MattBagg
我将数据修改为单独的列和数字,但仍然遇到相同的错误:“data.frame”:29 obs. of 4 variables. Data: $ id : Factor w/ 29 levels "10","11","12",..: 10 15 18 19 20 21 22 23 1 2 ... $ lon: num 7.17 7.17 7.17 7.18 $ lat: num 45.9 45.9 45.9 45.9 $ NA : num 0 0 0 0 0 0 0 0 0 Error: 不知道如何自动选择类型为standardGeneric的对象的比例。默认为连续型 Error in data.frame(x = c(7.1735, 7.17254, 7.171636, 7.18018, 7.17807, : 参数暗示了不同行数:29, 0 - A.Amidi

2

绘制点的一个问题是,如果在函数get_map()中使用zoom=10,则您的点将位于地图之外,无法绘制,因此我改用zoom=5

    library(ggmap)
    map <- get_map(location = 'Switzerland', zoom = 5, 
        maptype = "terrain",  source = "google") 

为了绘制地图,我使用了函数ggmap()。要添加点,可以使用geom_point()。为此,您的样本数据保存为数据框df,其中包含列xyid。要缩放到更接近的点,可以使用coord_map()

    p <- ggmap(map)
    p <- p +geom_point(data=df,aes(x=x,y=y))+
      coord_map(xlim=c(7,8),ylim=c(45.5,46))
    print(p)

如果您需要为每个点添加标签,则请将以下行添加到地图中的p
annotate("text",x=df$x,y=df$y,label=df$id)

enter image description here


正如您所看到的,点之间的短距离导致了不美观的呈现。您有什么想法来增强这个图形吗? - A.Amidi
@aliamidi 一个解决方案是尝试获取分辨率更高的地图(而不是谷歌地图)并将其用作背景。 - Didzis Elferts

网页内容由stack overflow 提供, 点击上面的
可以查看英文原文,
原文链接