您所描述的并不完全是传统意义上的图像处理,但使用numpy等工具很容易实现。
以下是一个相当大的示例,执行了您提到的一些操作,以指导您朝着正确的方向前进...请注意,示例图像都显示了原点在图像中心的结果,但函数接受一个原点参数,因此您可以直接为您的目的进行适应。
import numpy as np
import scipy as sp
import scipy.ndimage
import Image
import matplotlib.pyplot as plt
def main():
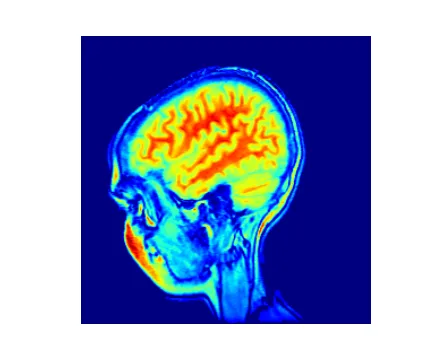
im = Image.open('mri_demo.png')
im = im.convert('RGB')
data = np.array(im)
plot_polar_image(data, origin=None)
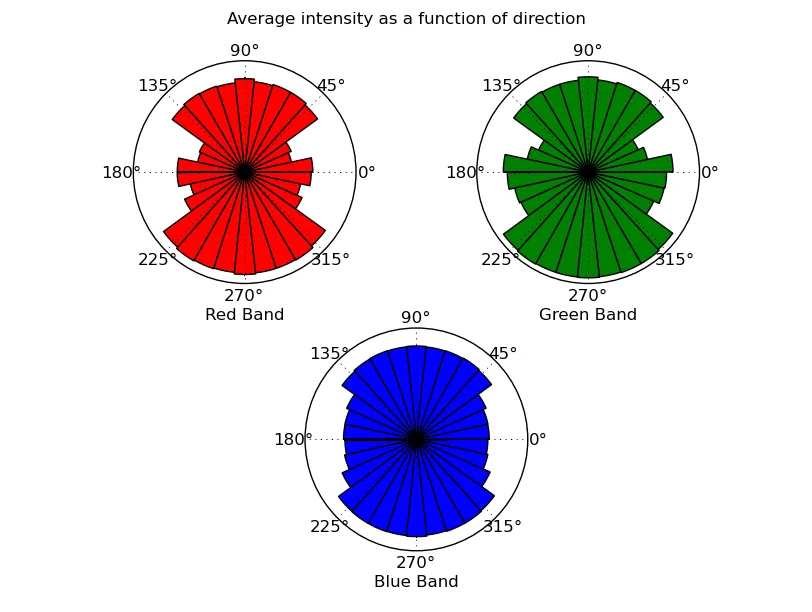
plot_directional_intensity(data, origin=None)
plt.show()
def plot_directional_intensity(data, origin=None):
"""Makes a cicular histogram showing average intensity binned by direction
from "origin" for each band in "data" (a 3D numpy array). "origin" defaults
to the center of the image."""
def intensity_rose(theta, band, color):
theta, band = theta.flatten(), band.flatten()
intensities, theta_bins = bin_by(band, theta)
mean_intensity = map(np.mean, intensities)
width = np.diff(theta_bins)[0]
plt.bar(theta_bins, mean_intensity, width=width, color=color)
plt.xlabel(color + ' Band')
plt.yticks([])
x, y = index_coords(data, origin)
r, theta = cart2polar(x, y)
red, green, blue = data.T
plt.figure()
plt.subplot(2,2,1, projection='polar')
intensity_rose(theta, red, 'Red')
plt.subplot(2,2,2, projection='polar')
intensity_rose(theta, green, 'Green')
plt.subplot(2,1,2, projection='polar')
intensity_rose(theta, blue, 'Blue')
plt.suptitle('Average intensity as a function of direction')
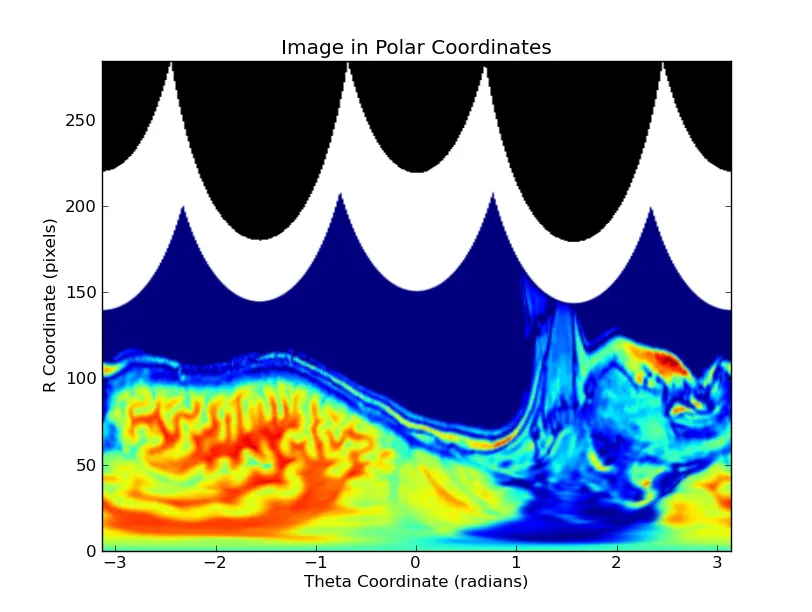
def plot_polar_image(data, origin=None):
"""Plots an image reprojected into polar coordinages with the origin
at "origin" (a tuple of (x0, y0), defaults to the center of the image)"""
polar_grid, r, theta = reproject_image_into_polar(data, origin)
plt.figure()
plt.imshow(polar_grid, extent=(theta.min(), theta.max(), r.max(), r.min()))
plt.axis('auto')
plt.ylim(plt.ylim()[::-1])
plt.xlabel('Theta Coordinate (radians)')
plt.ylabel('R Coordinate (pixels)')
plt.title('Image in Polar Coordinates')
def index_coords(data, origin=None):
"""Creates x & y coords for the indicies in a numpy array "data".
"origin" defaults to the center of the image. Specify origin=(0,0)
to set the origin to the lower left corner of the image."""
ny, nx = data.shape[:2]
if origin is None:
origin_x, origin_y = nx // 2, ny // 2
else:
origin_x, origin_y = origin
x, y = np.meshgrid(np.arange(nx), np.arange(ny))
x -= origin_x
y -= origin_y
return x, y
def cart2polar(x, y):
r = np.sqrt(x**2 + y**2)
theta = np.arctan2(y, x)
return r, theta
def polar2cart(r, theta):
x = r * np.cos(theta)
y = r * np.sin(theta)
return x, y
def bin_by(x, y, nbins=30):
"""Bin x by y, given paired observations of x & y.
Returns the binned "x" values and the left edges of the bins."""
bins = np.linspace(y.min(), y.max(), nbins+1)
bins[-1] += 1
indicies = np.digitize(y, bins)
output = []
for i in xrange(1, len(bins)):
output.append(x[indicies==i])
bins = bins[:-1]
return output, bins
def reproject_image_into_polar(data, origin=None):
"""Reprojects a 3D numpy array ("data") into a polar coordinate system.
"origin" is a tuple of (x0, y0) and defaults to the center of the image."""
ny, nx = data.shape[:2]
if origin is None:
origin = (nx//2, ny//2)
x, y = index_coords(data, origin=origin)
r, theta = cart2polar(x, y)
r_i = np.linspace(r.min(), r.max(), nx)
theta_i = np.linspace(theta.min(), theta.max(), ny)
theta_grid, r_grid = np.meshgrid(theta_i, r_i)
xi, yi = polar2cart(r_grid, theta_grid)
xi += origin[0]
yi += origin[1]
xi, yi = xi.flatten(), yi.flatten()
coords = np.vstack((xi, yi))
bands = []
for band in data.T:
zi = sp.ndimage.map_coordinates(band, coords, order=1)
bands.append(zi.reshape((nx, ny)))
output = np.dstack(bands)
return output, r_i, theta_i
if __name__ == '__main__':
main()
原始图像:
投影到极坐标系:
从图像中心方向的强度函数: