你可以将你的图像视为一个二维矩阵,其中每个像素具有X和Y坐标。
[(1,1)    (1,2)    (1,3)   ....   (1,c)]
[(2,1)    (2,2)    (2,3)   ....   (2,c)]
[(3,1)    (3,2)    (3,3)   ....   (3,c)]
[....     ....     ....    ....   .... ]
[(r,1)    (r,2)    (r,3)   ....   (r,c)]
在您发布的代码中,它将每个(X,Y)坐标映射到其相应的极坐标(R,theta),使用图像的中心
floor(c/2)和
floor(r/2)作为参考点。
% Map pixel value at (1,1) to it's polar equivalent
[r,theta] = cart2pol(1 - floor(r/2),1 - floor(c/2));
所以,无论在图像中使用什么像素值作为(1,1),现在应该出现在您的新极坐标空间中的
(r,theta)。需要注意的是,在执行此转换时,不需要关注图像中实际像素值的信息,而只需对图像中的每个像素执行此转换。
首先,我们要确定图像的中心位置:
[r, c] = size(img);
r = floor(r / 2);
c = floor(c / 2);
然后,我们计算出图像中每个点的(X,Y)坐标(在减去中心点之后)。
[X, Y] = meshgrid(-c:c-1,-r:r-1)
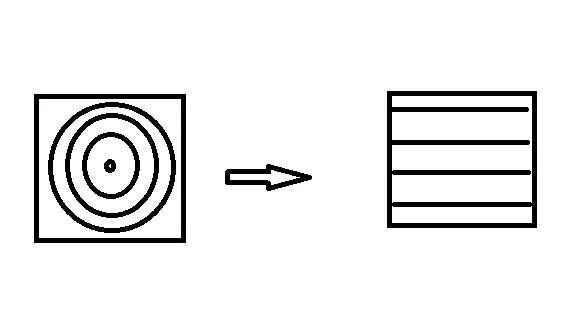
现在将所有这些笛卡尔坐标转换为极坐标。
[theta, rho] = cart2pol(X, Y);
现在,
warp 的作用只是在 (theta, rho) 对应的位置上显示
img 在 (X,Y) 处的值。
warp(theta, rho, zeros(size(theta)), img);
现在看起来你想要一个新的2D图像,其维度为[nTheta, nRho]。为此,你可以使用
griddata函数将散点(theta,rho)图像(由上面的
warp显示)进行插值,转换成规则网格。
rhoRange = linspace(0, max(rho(:)), 100);
thetaRange = linspace(-pi, pi, 100);
[T,R] = meshgrid(thetaRange, rhoRange);
theta_rho_image = griddata(theta, rho, double(img), T, R);
看看所有的插值方法
(interpolation methods),以确定哪种方法最适合您的情况。
还有一些其他问题(例如中心的四舍五入),导致结果略有不正确。下面提供了一个完整的工作示例。
radii = linspace(0, 40, 10);
rows = 100;
cols = 100;
img = zeros(rows, cols);
for k = 1:numel(radii)
t = linspace(0, 2*pi, 1000);
xx = round((cos(t) * radii(k)) + (cols / 2));
yy = round((sin(t) * radii(k)) + (rows / 2));
toremove = xx > cols | xx < 1 | yy > rows | yy < 1;
inds = sub2ind(size(img), xx(~toremove), yy(~toremove));
img(inds) = 1;
end
[r,c] = size(img);
center_row = r / 2;
center_col = c / 2;
[X,Y] = meshgrid((1:c) - center_col, (1:r) - center_row);
[theta, rho] = cart2pol(X, Y);
rhoRange = linspace(0, max(rho(:)), 1000);
thetaRange = linspace(-pi, pi, 1000);
[T, R] = meshgrid(thetaRange, rhoRange);
theta_rho_image = griddata(theta, rho, double(img), T, R);
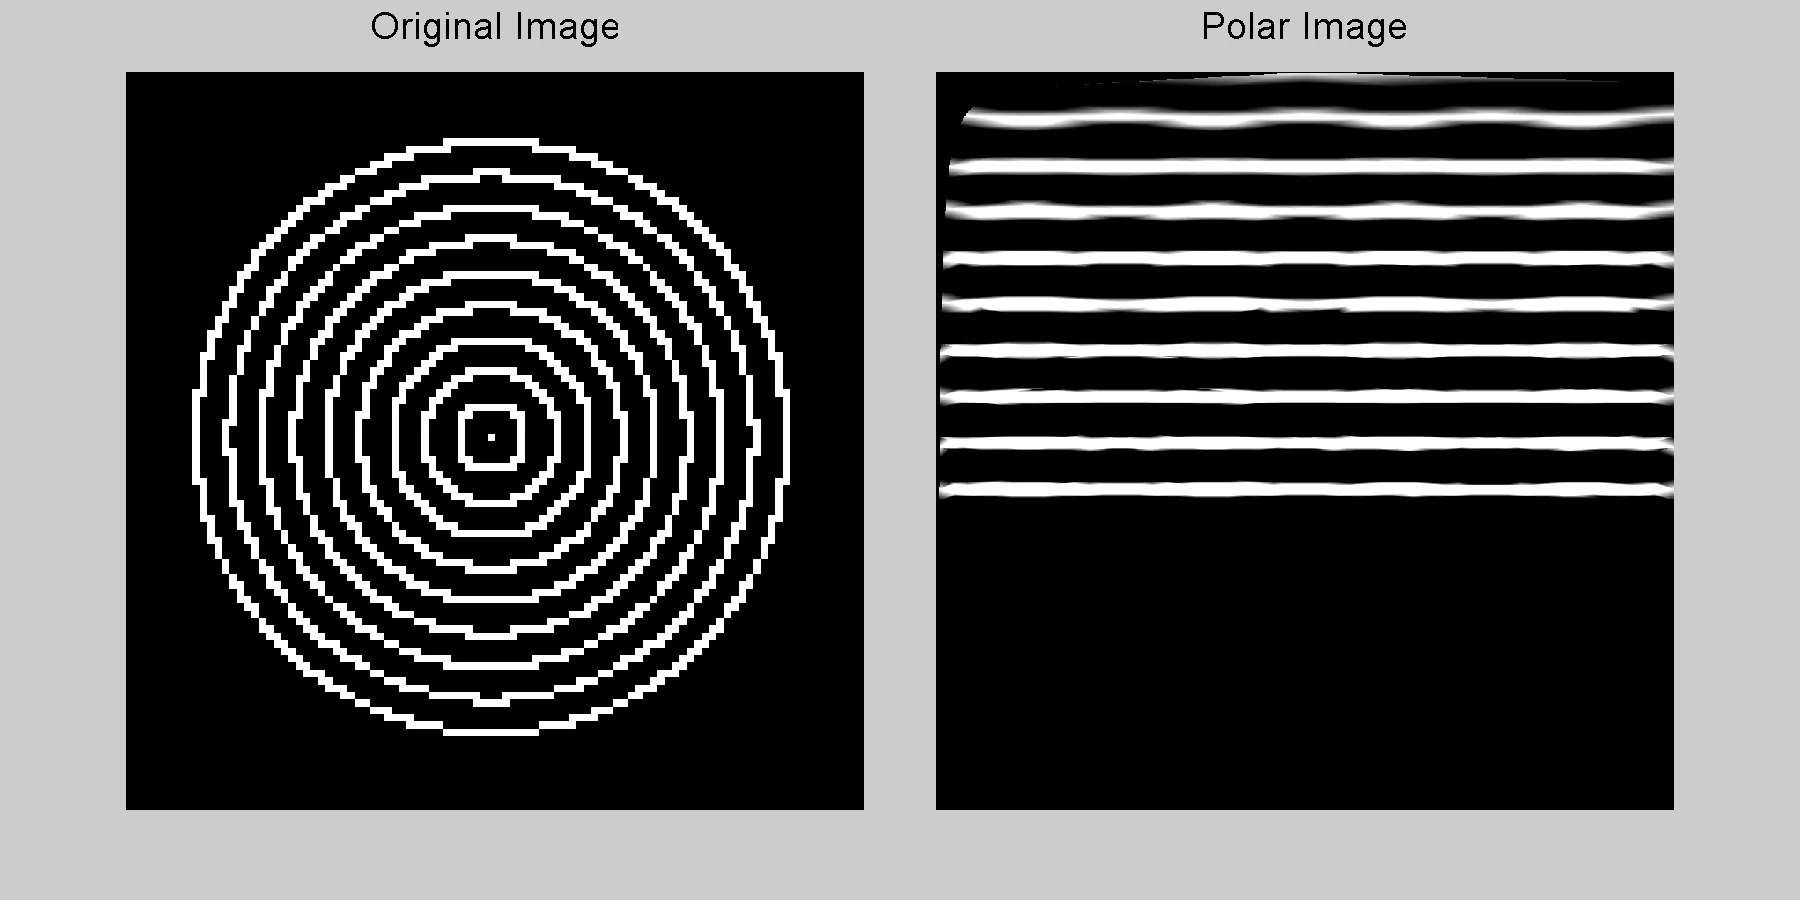
figure
subplot(1,2,1);
imshow(img);
title('Original Image')
subplot(1,2,2);
imshow(theta_rho_image);
title('Polar Image')
结果如下:
interp2(theta, rho, img, T, R)替换为interp2(theta, rho, double(img), T, R)即可。 - Suevergriddata,它具有相同的格式但处理分散数据。 - Suever