我的数学知识有限,这可能就是我卡住的原因。我有一个光谱图,想要用两个高斯峰拟合它。我可以对最大的峰进行拟合,但无法对最小的峰进行拟合。我知道需要将两个峰的高斯函数求和,但不知道哪里出错了。我的当前输出如下图所示:
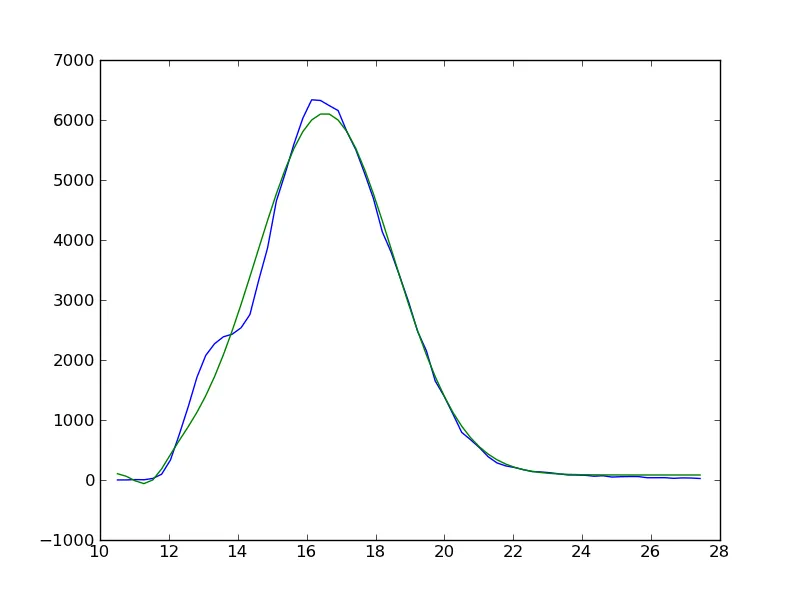 蓝线是我的数据,绿线是当前拟合曲线。我的数据中主峰左侧有一个肩峰,我正在尝试使用以下代码进行拟合:
蓝线是我的数据,绿线是当前拟合曲线。我的数据中主峰左侧有一个肩峰,我正在尝试使用以下代码进行拟合:import matplotlib.pyplot as pt
import numpy as np
from scipy.optimize import leastsq
from pylab import *
time = []
counts = []
for i in open('/some/folder/to/file.txt', 'r'):
segs = i.split()
time.append(float(segs[0]))
counts.append(segs[1])
time_array = arange(len(time), dtype=float)
counts_array = arange(len(counts))
time_array[0:] = time
counts_array[0:] = counts
def model(time_array0, coeffs0):
a = coeffs0[0] + coeffs0[1] * np.exp( - ((time_array0-coeffs0[2])/coeffs0[3])**2 )
b = coeffs0[4] + coeffs0[5] * np.exp( - ((time_array0-coeffs0[6])/coeffs0[7])**2 )
c = a+b
return c
def residuals(coeffs, counts_array, time_array):
return counts_array - model(time_array, coeffs)
# 0 = baseline, 1 = amplitude, 2 = centre, 3 = width
peak1 = np.array([0,6337,16.2,4.47,0,2300,13.5,2], dtype=float)
#peak2 = np.array([0,2300,13.5,2], dtype=float)
x, flag = leastsq(residuals, peak1, args=(counts_array, time_array))
#z, flag = leastsq(residuals, peak2, args=(counts_array, time_array))
plt.plot(time_array, counts_array)
plt.plot(time_array, model(time_array, x), color = 'g')
#plt.plot(time_array, model(time_array, z), color = 'r')
plt.show()