目前,我正在根据Fitting empirical distribution to theoretical ones with Scipy (Python)?中的说明,将经验分布与理论分布进行拟合。使用scipy.stats分布,结果显示双曲正切分布的拟合效果很好。以下是我当前使用一些 scipys 分布的方法:
# -*- coding: utf-8 -*-
import pandas as pd
import numpy as np
import scipy.stats
import matplotlib.pyplot as plt
# Sample data with random numbers of hypsecant distribution
data = scipy.stats.hypsecant.rvs(size=8760, loc=1.93, scale=7.19)
# Distributions to check
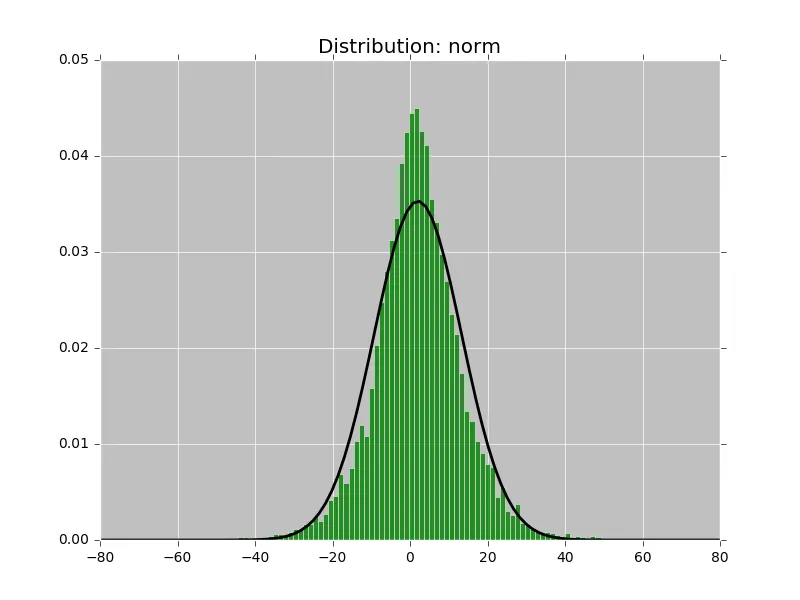
dist_names = ['gausshyper', 'norm', 'gamma', 'hypsecant']
for dist_name in dist_names:
dist = getattr(scipy.stats, dist_name)
# Fit a distribution to the data
param = dist.fit(data)
# Plot the histogram
plt.hist(data, bins=100, normed=True, alpha=0.8, color='g')
# Plot and save the PDF
xmin, xmax = plt.xlim()
x = np.linspace(xmin, xmax, 100)
p = dist.pdf(x, *param[:-2], loc=param[-2], scale=param[-1])
plt.plot(x, p, 'k', linewidth=2)
title = 'Distribution: ' + dist_name
plt.title(title)
plt.savefig('fit_' + dist_name + '.png')
plt.close()
以下是类似于下面的图表:
但我还想测试一下(广义)双曲线分布是否更适合,因为我认为它可能会提供更好的拟合。
在scipy.stats中是否有可用的双曲线分布?或者是否有其他解决方法?
也可以使用其他软件包。
提前感谢!