在网络图上绘制样本图片。

3

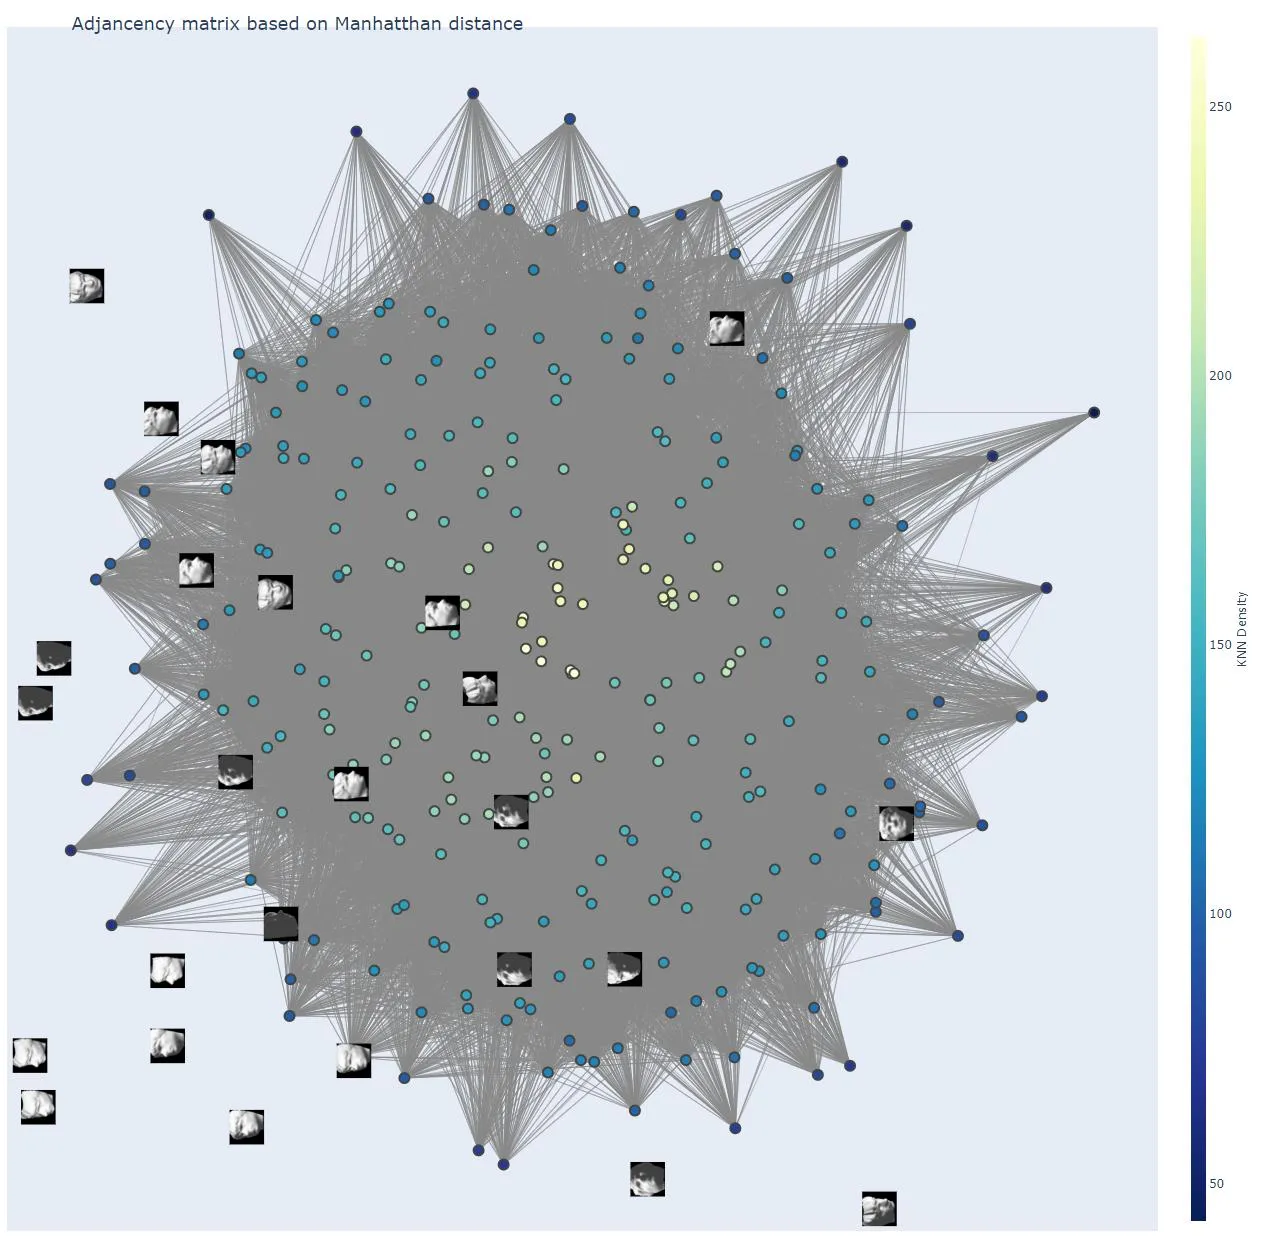
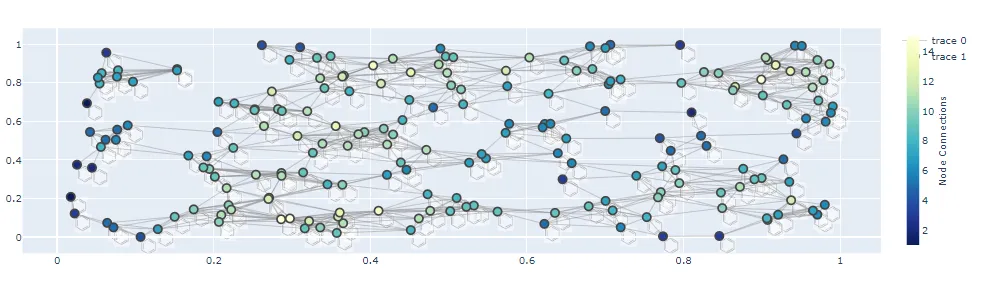
我正在使用Plotly显示一个网络图,并尝试显示属于特定数据点的示例图像(每个数据点都是一个64x64的雕塑亮度图)。 我有两个问题:

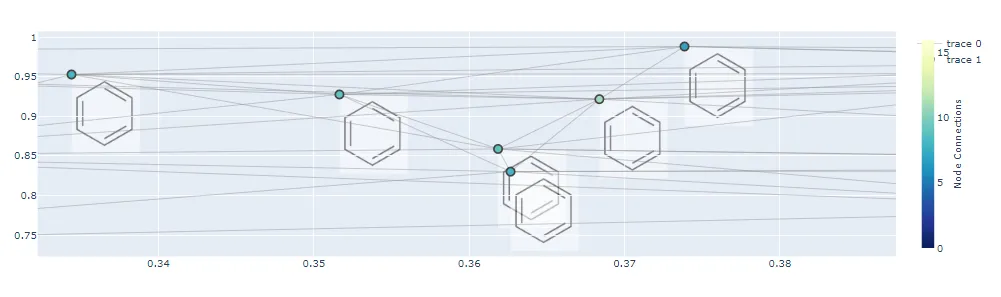
  1. 我正在使用数据点坐标来定位图像,但它们没有对齐。 我尝试使用xanchor/yanchor来修复它,但它没有起作用。
  2. 虽然我正在绘制100张图像,但只有少数几张实际可见。 如果我放大可视化,我可以看到更多的图像,但我想强制Plotly显示所有图像。 我尝试了layer ='above',但没有起作用。
  3. 如果有一种方法将图像与实际数据点链接起来,那将是很好的,但我不知道如何做到这一点。

def plot_graph(G, plot_title, dataset, coordinates=None):

if coordinates == None:
    coordinates = nx.drawing.spring_layout(G, weight=None)

edge_x = []
edge_y = []
for edge in G.edges():
    x0, y0 = coordinates[edge[0]]
    x1, y1 = coordinates[edge[1]]
    edge_x.extend([x0, x1])
    edge_y.extend([y0, y1])

edge_trace = go.Scatter(x=edge_x,
                        y=edge_y,
                        line=dict(width=0.5, color='#888'),
                        hoverinfo='none',
                        mode='lines'
                        )

node_x = []
node_y = []
for node in G.nodes():
    x, y = coordinates[node]
    node_x.append(x)
    node_y.append(y)

colorbar_attrs = dict(thickness=15, title='KNN Density', xanchor='left', titleside='right')
marker_attrs = dict(showscale=True,
                    colorscale='YlGnBu',
                    reversescale=True,
                    color=[], size=10,
                    colorbar=colorbar_attrs,
                    line_width=2)

node_trace = go.Scatter(x=node_x, y=node_y, mode='markers', hoverinfo='text', marker=marker_attrs)

node_adjacencies = []
node_text = []

for node, adjacencies in enumerate(G.adjacency()):
    node_adjacencies.append(len(adjacencies[1]))
    node_text.append('K-Nearest Neighbors: '+str(len(adjacencies[1])))


node_trace.marker.color = node_adjacencies
node_trace.text = node_text
fig = go.Figure(data=[edge_trace, node_trace],
                layout=go.Layout(
                title='<br> {}'.format(plot_title),
                titlefont_size=18,
                showlegend=False,
                hovermode='closest',
                margin=dict(b=20,l=5,r=5,t=40),
                xaxis=dict(showgrid=False, zeroline=False, showticklabels=False),
                yaxis=dict(showgrid=False, zeroline=False, showticklabels=False))
                )

num_images = 100
num_faces = dataset.shape[0]
sample_images = np.random.choice(num_faces, num_images, replace=False)
greys = cm.get_cmap('Greys_r')

for index in sample_images:
    greyscale = np.apply_along_axis(greys, 0, dataset[index]).reshape((64, 64, 4))*255
    greyscale = greyscale.astype(np.uint8)
    im = pilim.fromarray(greyscale)
    fig.add_layout_image(dict(
        source=im,
        x=coordinates[index][0],
        y=coordinates[index][1],
        sizex=0.03,
        sizey=0.03,
        layer='above'
                         ))

return fig

我得到的是这个:

输入图片说明


是否可以提供一个最小可复现示例?或者尝试简化问题,看看能否解决? - SKPS
1个回答

1

第一篇

由于您没有提供一个完全可重现的例子,直接解决您的问题是比较困难的。但我有一个建议,基于plot.ly/python/network-graphs/中的顶部示例,并使用benze.png这个也在other plotly examples中使用的图像。该图像多次存储在列表中,因此您应该能够轻松地用其他图像的引用替换它们。我从fig['data'][1]['x']fig['data'][1]['y']中获取X,Y坐标,但这应该很容易调整到其他来源。

图表1:

enter image description here

"Plot 2: 放大后的视图"

enter image description here

现在,如果我正确地理解了您的挑战,这个图表符合您关于所有三个标准的要求:

  1. 数据点对齐
  2. 所有图像都显示
  3. 图像直接与所有数据点对齐

请不要犹豫,让我知道这对您有何帮助!

代码:

import plotly.graph_objects as go
import networkx as nx

G = nx.random_geometric_graph(200, 0.125)

edge_x = []
edge_y = []
for edge in G.edges():
    x0, y0 = G.nodes[edge[0]]['pos']
    x1, y1 = G.nodes[edge[1]]['pos']
    edge_x.append(x0)
    edge_x.append(x1)
    edge_x.append(None)
    edge_y.append(y0)
    edge_y.append(y1)
    edge_y.append(None)

edge_trace = go.Scatter(
    x=edge_x, y=edge_y,
    line=dict(width=0.5, color='#888'),
    hoverinfo='none',
    mode='lines')

node_x = []
node_y = []
for node in G.nodes():
    x, y = G.nodes[node]['pos']
    node_x.append(x)
    node_y.append(y)

node_trace = go.Scatter(
    x=node_x, y=node_y,
    mode='markers',
    hoverinfo='text',
    marker=dict(
        showscale=True,
        colorscale='YlGnBu',
        reversescale=True,
        color=[],
        size=10,
        colorbar=dict(
            thickness=15,
            title='Node Connections',
            xanchor='left',
            titleside='right'
        ),
        line_width=2))

node_adjacencies = []
node_text = []
for node, adjacencies in enumerate(G.adjacency()):
    node_adjacencies.append(len(adjacencies[1]))
    node_text.append('# of connections: '+str(len(adjacencies[1])))

node_trace.marker.color = node_adjacencies
node_trace.text = node_text

fig = go.Figure(data=[edge_trace, node_trace])

# sample images
sample_images=["https://raw.githubusercontent.com/michaelbabyn/plot_data/master/benzene.png"]*len(fig['data'][1]['x'])
xVals = fig['data'][1]['x']
yVals = fig['data'][1]['y']

for i in range(0, len(xVals)):  
    fig.add_layout_image(dict(
        source=sample_images[i],
        x=xVals[i],
        y=yVals[i],
        xref="x",
        yref="y",
        #sizex=0.03,
        #sizey=0.03,
        #layer='above'
        sizex=0.1,
        sizey=0.1,
        #sizing="stretch",
        opacity=0.5,
        layer="below"
    ))

fig.show()

非常感谢!是的,这对我帮助很大。抱歉这么晚才接受。 - Juan David
@JuanDavid 没问题。很高兴能帮忙! - vestland

网页内容由stack overflow 提供, 点击上面的
可以查看英文原文,
原文链接