在地图上绘制路线

3

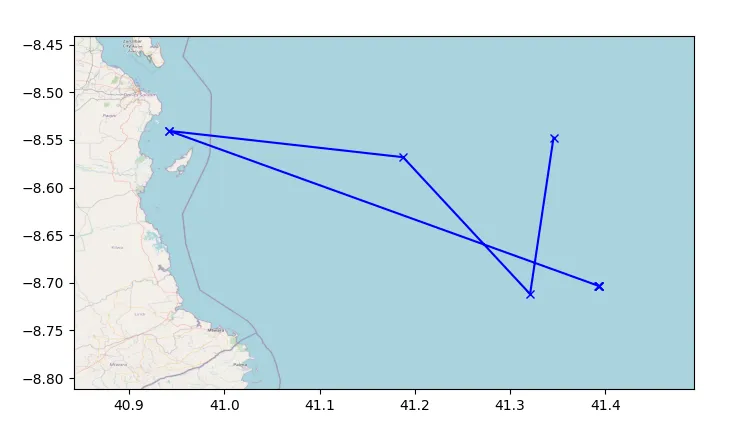
我是使用Python,并需要在地图上绘制路线。我有一个类似于以下的数据框:

  latitude  longitude
  41.393095  -8.703483
  41.393095  -8.703483
  41.393095  -8.703483
  41.392483  -8.703088
  40.942170  -8.540572
  40.942188  -8.540567
  41.187624  -8.568143
  41.321009  -8.711874
  41.345618  -8.547567

数据框的顺序表示路线的顺序,我想根据纬度和经度绘制它。但是,我只能找到根据osm节点ID绘制它的方法。有没有人知道一种使用精确地理坐标绘制此路线的方法?谢谢!
1个回答

7

使用这篇教程,我成功地在地图上标注了这些点:

地图路径图像

# Create a bounding box to determine the size of the required map
BBox = (df.longitude.min()-0.1,   df.longitude.max()+0.1,
        df.latitude.min()-0.1, df.latitude.max()+0.1)

# Downloaded using this tutorial: https://medium.com/@abuqassim115/thanks-for-your-response-frank-fb869824ede2
map_img = plt.imread('map.png')

# Plotting the points on the graph
fig, ax = plt.subplots(figsize=(8, 7))
ax.plot(df.longitude, df.latitude, 'xb-')

# Setting limits for the plot
ax.set_xlim(BBox[0], BBox[1])
ax.set_ylim(BBox[2], BBox[3])

# Showing the image behind the points
ax.imshow(map_img, zorder=0, extent=BBox, aspect='equal')

plt.show()

网页内容由stack overflow 提供, 点击上面的
可以查看英文原文,
原文链接