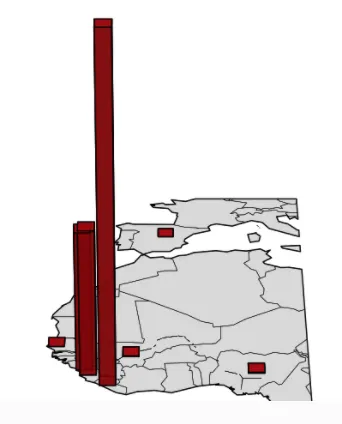
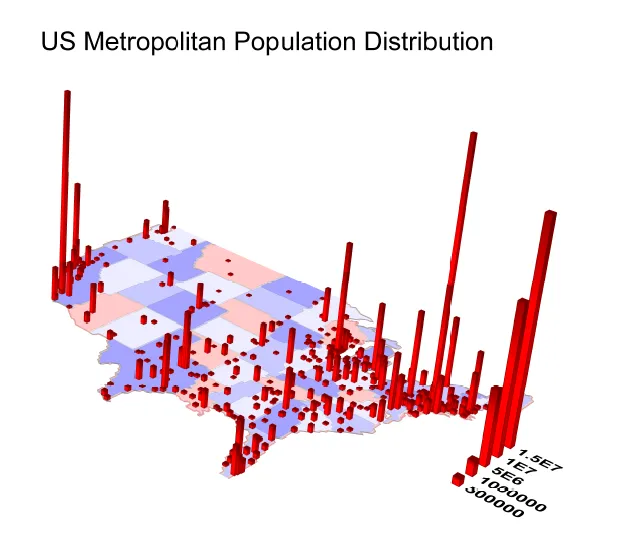
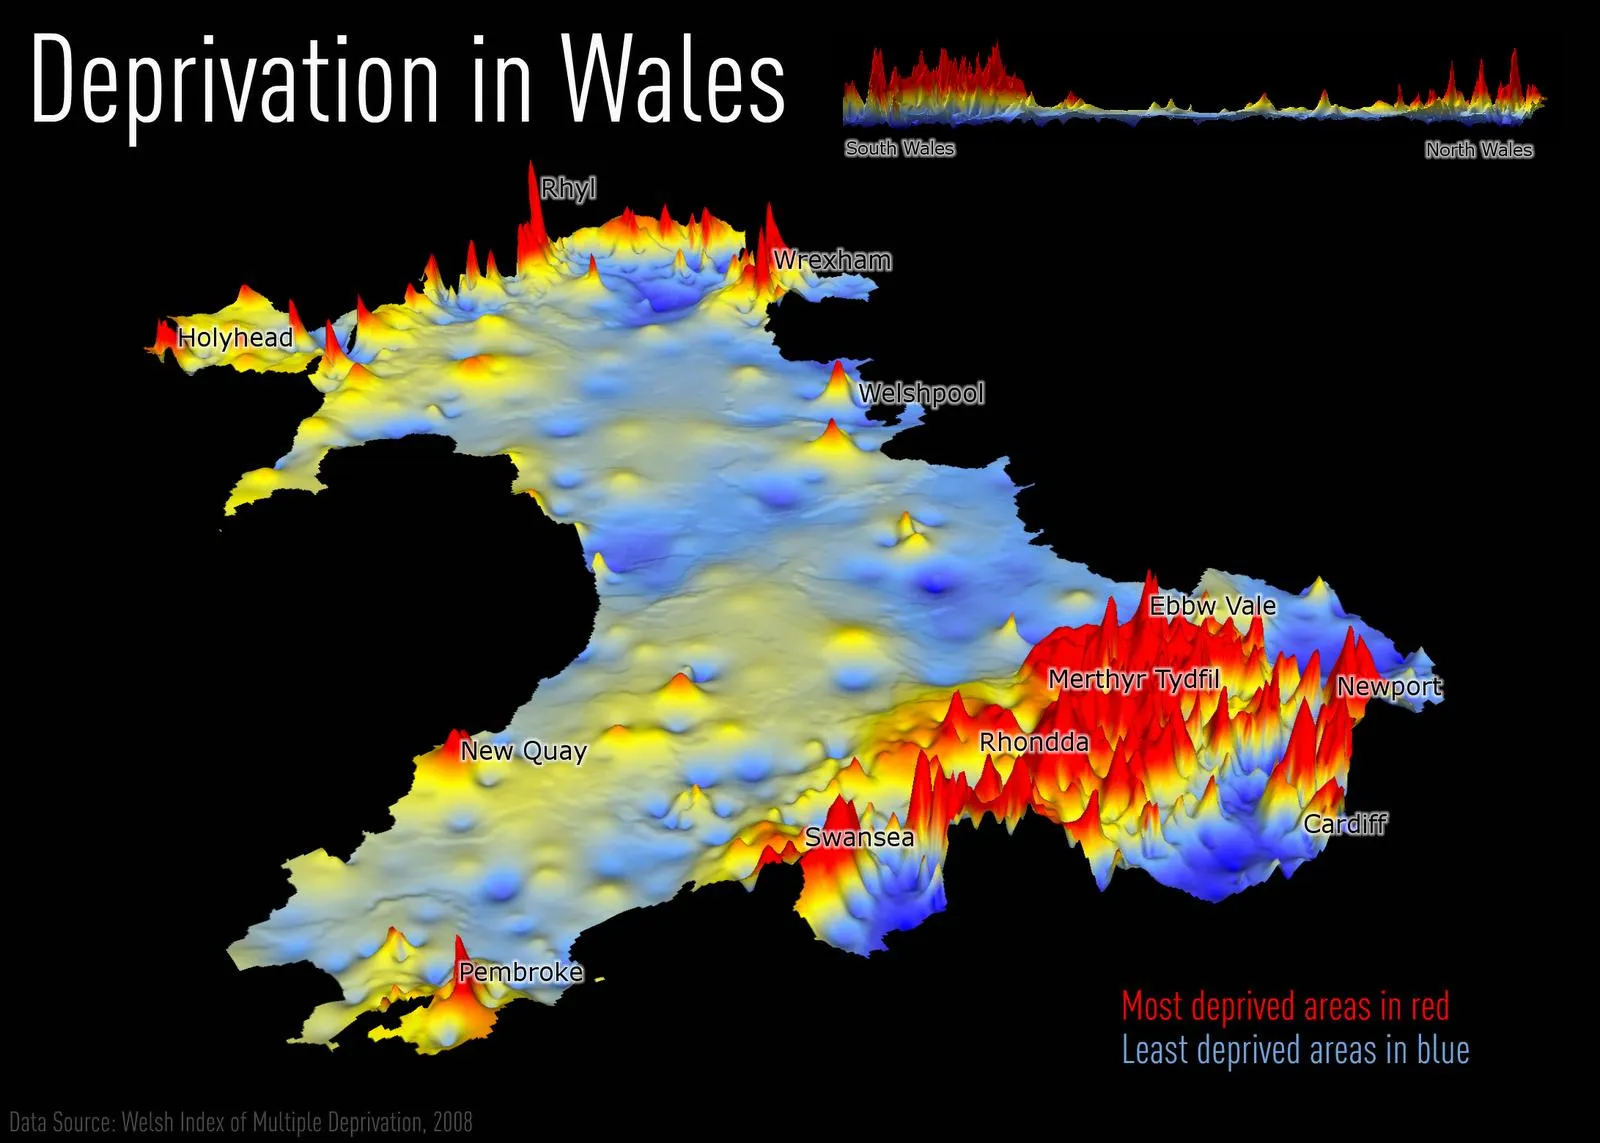
我有一组数据,格式为(纬度、经度、数值)。我想在城市地图上绘制(纬度、经度) -> 数值的图像,类似于以下图片:
 我已经尝试了以下方法:
我已经尝试了以下方法:
- Python的Matplotlib:无法找到所需函数
- Plotly
- r-barplots on map,RG-histogram-bar-chart-over-map。
- plot-3d-bars-on-a-map-in-matlab: 这个可以实现,但我正在尝试在Python中找到类似的东西
- D3 map histogram:这让我可以按城市绘制,但无法在一个城市内部绘制。