我有一个经纬度向量和另一个带有Z值的向量,需要在3D地图上显示,就像下图右边的那个一样。我尝试使用bar3,但它很麻烦,因为需要创建多个图形。
以下是一些代码:
有什么想法可以帮我完成这个吗? 谢谢!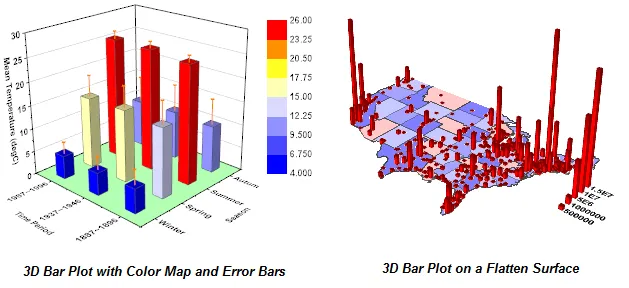
以下是一些代码:
S4 = shaperead(filename)
plot([S4.X],[S4.Y],'k'); % plots the map from a shapefile I loaded previously
XX = [-50 -51 ...];
YY = [-1 -2 ...];
ZZ = [ 2.2 3.2 ... ];
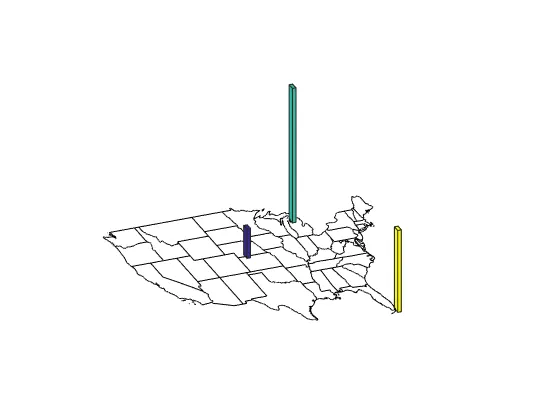
stem3(XX,YY,ZZ) % this is an option, but doesn't look good!! :(
有什么想法可以帮我完成这个吗? 谢谢!