我虽然有C++和MATLAB的使用经验,但对Python还是新手。目前,我正在编写一个程序,用于绘制涉及dy/dt和dx/dt的非线性系统在相空间中的轨迹。然而,对于更复杂的函数形式,我遇到了Overflow Error错误。有没有办法可以解决这个问题呢?提前感谢!
以下是我的代码:
fig = plt.figure(figsize=(18,6))
dt = 0.01
def trajectories():
#initial conditions
x = y = 0.1
xresult = [x]
yresult = [y]
for t in xrange(10000):
# functional form: dx/dt = y, dy/dt = -r(x**2-1)*y-x
nextx = x + (r*x-y+x*y**2) * dt
nexty = y + (x + r*y + y**3) * dt
x, y = nextx, nexty
xresult.append(x)
yresult.append(y)
plt.plot(xresult, yresult)
plt.axis('image')
plt.axis([-3, 3, -3, 3])
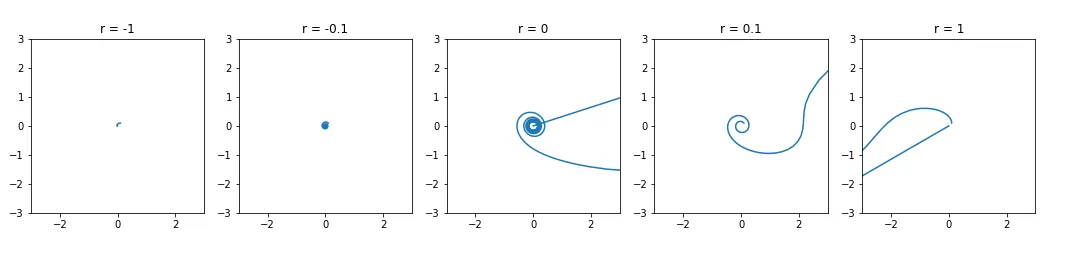
plt.title('r = ' + str(r))
rs = [-1, -0.1, 0, .1, 1]
for i in range(len(rs)):
fig.add_subplot(1, len(rs), i + 1)
r = rs[i]
trajectories()
plt.show()
EDIT: this is the full traceback
Traceback (most recent call last):
File "/Users/Griffin/Atom/NumInt.py", line 33, in <module>
trajectories()
File "/Users/Griffin/Atom/NumInt.py", line 18, in trajectories
nextx = x + (r*x-y+x*y**2) * dt
OverflowError: (34, 'Result too large')