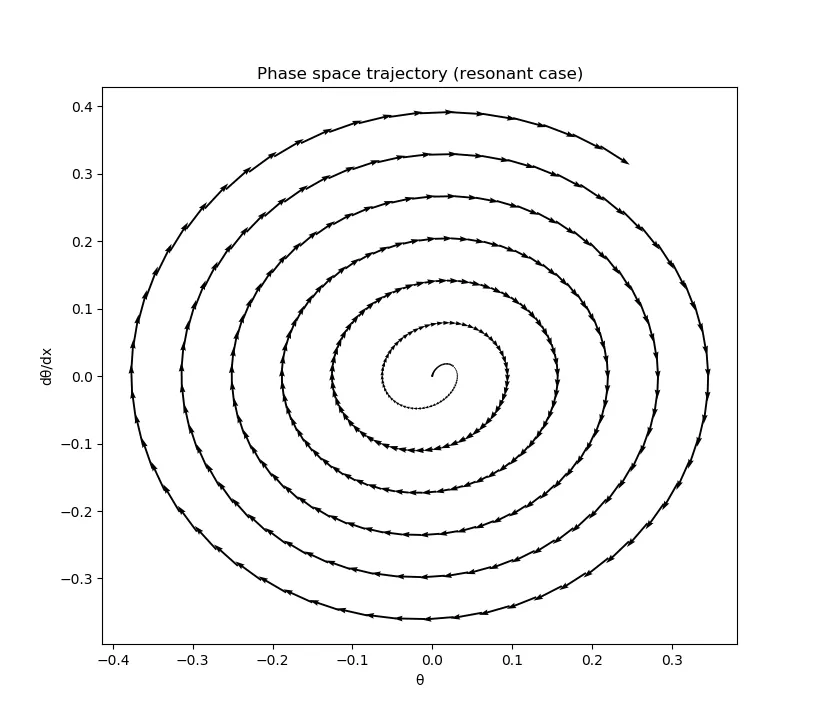
在下面的代码中,我已经找到了解决一组微分方程的方法。我已经在这段代码中绘制了相空间轨迹,并且它可以正常工作。但是,我想重复一下绘图,但是带有箭头以帮助我清楚地展示绘图的含义。
我看到有类似的问题被提出:
在matplotlib中绘制带箭头的相空间轨迹
因此,在下面的代码中,我尝试为我的情况复制它。(我会将这个问题发布在那个主题中,但是它不允许我这样做)
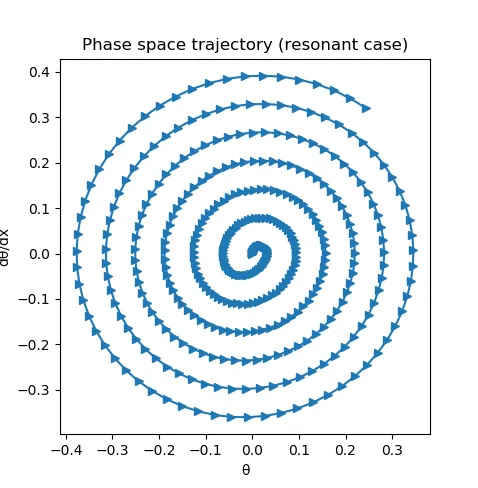
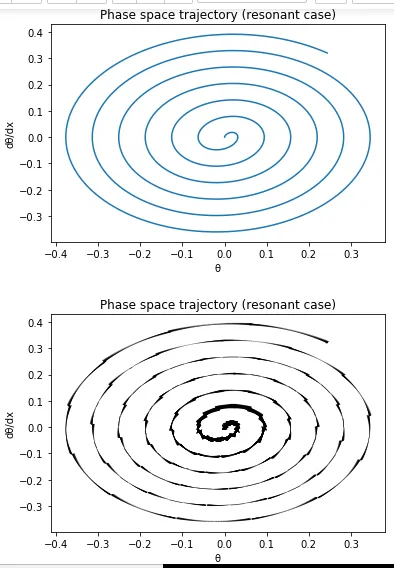
当我运行代码时,我得到的图像如下:
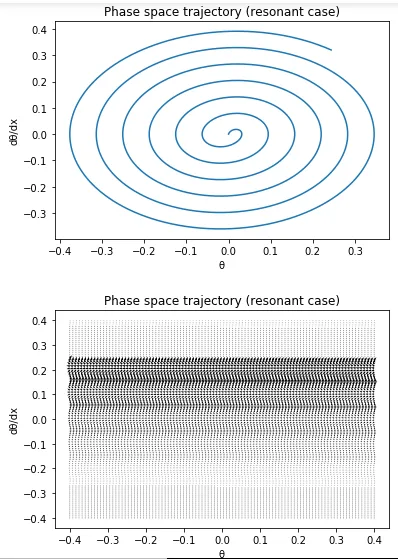
很明显我在理解箭头函数时犯了错误(因为图形应该看起来相同(只是第二个应该有箭头),但很明显不是这种情况,而且我注意到改变我的 linspace 中的点数会极大地改变第二张图)。
我的代码如下:
# Import the required modules
import numpy as np
from run_kut4 import *
from printSoln import *
import pylab

def G2(x,y):
    G2=np.zeros(2)
    G2[0]=y[1]
    G2[1]=-np.sin(y[0])+0.02*np.cos(y[0])*np.sin(x)
    return G2
x2=0.0
xstop2=40.0
y2=np.array([0.0,0.0])
h2=0.005#step size
#freq=1

X2,Y2=integrate(G2,x2,y2,xstop2,h2)

pylab.plot(Y2[:,0],Y2[:,1])
pylab.xlabel('θ')
pylab.ylabel('dθ/dx')
pylab.title('Phase space trajectory (resonant case)')
pylab.show()

y1=np.linspace(-0.4,0.4,100)
y2=np.linspace(-0.4,0.4,100)
U,V=np.meshgrid(y1,y2)

pylab.quiver(U,V,Y2[:,0],Y2[:,1])
pylab.xlabel('θ')
pylab.ylabel('dθ/dx')
pylab.title('Phase space trajectory (resonant case)')
pylab.show()
我想知道是否有人能看出我的错误,任何帮助都将不胜感激。谢谢 :)
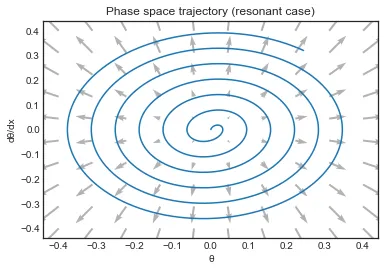
我尝试按照语法建议切换了U和V,并得到了以下结果:
使用的Runge Kutta代码:
  ## module run_kut4
  ''' X,Y = integrate(F,x,y,xStop,h).
  4th-order Runge-Kutta method for solving the
  initial value problem {y}' = {F(x,{y})}, where
  {y} = {y[0],y[1],...y[n-1]}.
  x,y   = initial conditions
  xStop = terminal value of x
  h     = increment of x used in integration
  F     = user-supplied function that returns the
  array F(x,y) = {y'[0],y'[1],...,y'[n-1]}.
  '''
import numpy as np
def integrate(F,x,y,xStop,h):

def run_kut4(F,x,y,h):
    K0 = h*F(x,y)
    K1 = h*F(x + h/2.0, y + K0/2.0)
    K2 = h*F(x + h/2.0, y + K1/2.0)
    K3 = h*F(x + h, y + K2)
    return (K0 + 2.0*K1 + 2.0*K2 + K3)/6.0

X = []
Y = []
X.append(x)
Y.append(y)
while x < xStop:
    h = min(h,xStop - x)
    y = y + run_kut4(F,x,y,h)
    x = x + h
    X.append(x)
    Y.append(y)
return np.array(X),np.array(Y)