手动设置图例中点的颜色

53

我正在制作一个散点图,看起来像这样:

enter image description here

如上图所示,图例中点的颜色是由
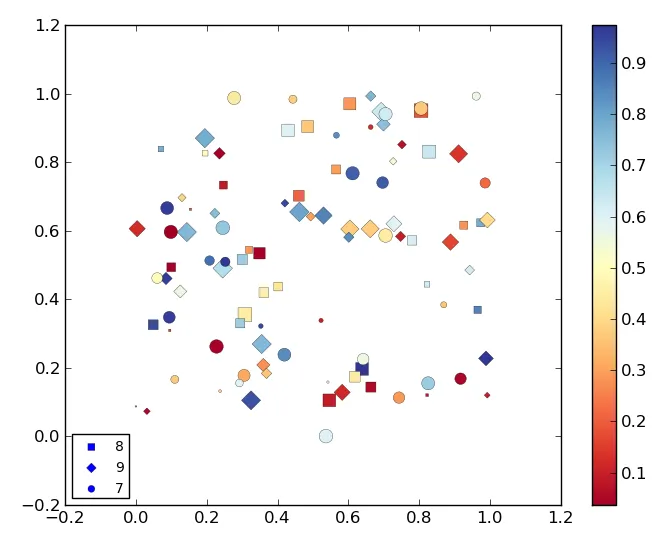
matplotlib自动设置为蓝色。我需要将这些点的颜色设置为一些不在颜色映射中的其他颜色(例如:黑色),以便它们不会与与该颜色映射相关联的颜色产生混淆。
我查看了matplotlib.legend模块,但似乎没有接受color关键字的方法。有什么办法可以做到这一点吗?

这是最小工作示例:

import matplotlib.pyplot as plt
import numpy as np

def rand_data():
    return np.random.uniform(low=0., high=1., size=(100,))

# Generate data.
x, y, x2, x3 = [rand_data() for i in range(4)]
# This data defines the markes and labels used.
x1 = np.random.random_integers(7, 9, size=(100,))

# Order all lists so smaller points are on top.
order = np.argsort(-np.array(x2))
# Order x and y.
x_o, y_o = np.take(x, order), np.take(y, order)
# Order list related to markers and labels.
z1 = np.take(x1, order)
# Order list related to sizes.
z2 = np.take(x2, order)
# Order list related to colors.
z3 = np.take(x3, order)

plt.figure()
cm = plt.cm.get_cmap('RdYlBu')

# Scatter plot where each value in z1 has a different marker and label
# assigned.
mrk = {7: ('o', '7'), 8: ('s', '8'), 9: ('D', '9')}
for key, value in mrk.items():

    s1 = (z1 == key)
    plt.scatter(x_o[s1], y_o[s1], marker=value[0], label=value[1],
        s=z2[s1] * 100., c=z3[s1], cmap=cm, lw=0.2)

# Plot colorbar
plt.colorbar()

# Plot legend.
plt.legend(loc="lower left", markerscale=0.7, scatterpoints=1, fontsize=10)

plt.show()
5个回答

74
您可以获取图例句柄并单独更改它们的颜色:
ax = plt.gca()
leg = ax.get_legend()
leg.legendHandles[0].set_color('red')
leg.legendHandles[1].set_color('yellow')

10

补充之前的回答——我曾经尝试使用set_color更改图例标记的颜色,但遇到了问题。另一种方法是自行构建图例:

import matplotlib.lines as mlines

eight = mlines.Line2D([], [], color='blue', marker='s', ls='', label='8')
nine = mlines.Line2D([], [], color='blue', marker='D', ls='', label='9')
# etc etc
plt.legend(handles=[eight, nine])

从头开始构建图例有时可以避免处理已经构建好的图例不透明的内部。Matplotlib文档中有更多信息,请点击这里

3
“ax.get_legend()” 方法对我没有起作用(可能是因为我基于条件设置了点的颜色)。自己构建图例非常有效。在这里留下评论,以便其他处于类似情况的人可以找到有用的信息。 谢谢! - MadPhysicist

3

如果您想将颜色映射到特定标签,可以使用lh.get_label()检索每个图例句柄的标签。

为了达到我的目的,最好从legendHandles创建一个字典,并像下面这样更改颜色:

ax = plt.gca()
leg = ax.get_legend()
hl_dict = {handle.get_label(): handle for handle in leg.legendHandles}
hl_dict['9'].set_color('red')
hl_dict['8'].set_color('yellow')

1

虽然我发现使用 legendHandles[i].set_color 的解决方案无法用于 errorbar,但我成功地采用了以下解决方法:

ax_legend = fig.add_subplot(g[3, 0])
ax_legend.axis('off')
handles_markers = []
markers_labels = []
for marker_name, marker_style in markers_style.items():
    pts = plt.scatter([0], [0], marker=marker_style, c='black', label=marker_name)
    handles_markers.append(pts)
    markers_labels.append(marker_name)
    pts.remove()
ax_legend.legend(handles_markers, markers_labels, loc='center', ncol=len(markers_labels), handlelength=1.5, handletextpad=.1)

请参见this GitHub issue

0
关于 @Saullo G. P. Castro 的回答:
MatplotlibDeprecationWarning:在 Matplotlib 3.7 中,legendHandles 属性已被弃用,并将在两个次要版本后删除。请改用 legend_handles。

未来使用:

ax = plt.gca()
leg = ax.get_legend()
leg.legend_handles[0].set_color('red')
leg.legend_handles[1].set_color('yellow')

网页内容由stack overflow 提供, 点击上面的
可以查看英文原文,
原文链接