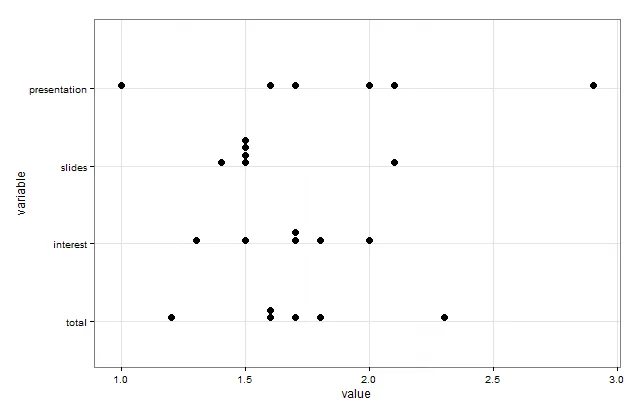
试图回答这个问题时,创建所需的图形的一种方法是使用ggplot2中的geom_dotplot,如下所示:
library(ggplot2)
library(reshape2)

CTscores <- read.csv(text="initials,total,interest,slides,presentation
CU,1.6,1.7,1.5,1.6
DS,1.6,1.7,1.5,1.7
VA,1.7,1.5,1.5,2.1
MB,2.3,2.0,2.1,2.9
HS,1.2,1.3,1.4,1.0
LS,1.8,1.8,1.5,2.0")

CTscores.m = melt(CTscores, id.var="initials")

ggplot(CTscores.m, aes(x=variable, y=value)) +
  geom_dotplot(binaxis="y", stackdir="up",binwidth=0.03) +
  theme_bw()+coord_flip()
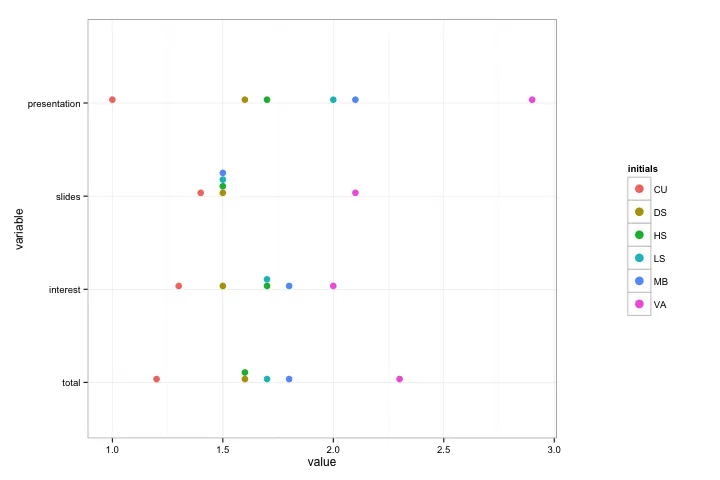
geom_dotplot对颜色敏感,无法堆叠它们:ggplot(CTscores.m, aes(x=variable, y=value, fill=initials)) +
geom_dotplot(binaxis="y", stackdir="up",binwidth=0.03,color=NA) +
theme_bw()+coord_flip()
可以使用一个hack手动添加颜色:
gg_color_hue <- function(n) {
  hues = seq(15, 375, length=n+1)
  hcl(h=hues, l=65, c=100)[1:n]
}

cols <- rep(gg_color_hue(6),4)

ggplot(CTscores.m, aes(x=variable, y=value)) +
  geom_dotplot(binaxis="y", stackdir="up",binwidth=0.03,fill=cols,color=NA) +
  theme_bw()+coord_flip()
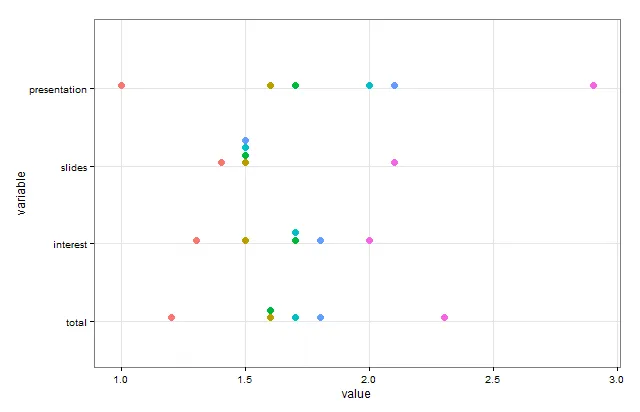
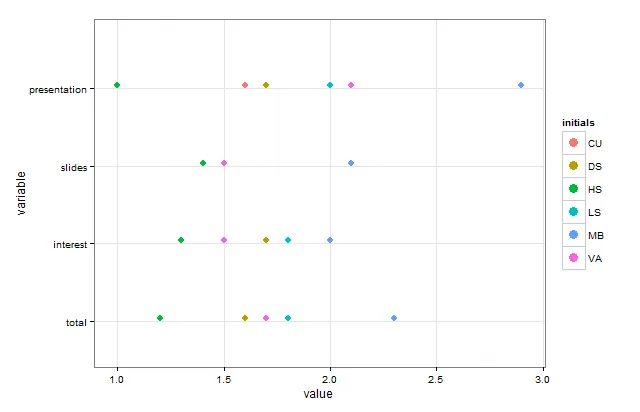
很遗憾,没有图例。另外我们不能使用 aes(fill=) 来手动添加图例,因为它会使点坍塌。有没有不使用 aes() 的方法来添加图例呢?