我正在创建一个具有多种线型、颜色和填充区域的图表。以下代码生成了两个图例(一个显示线型,另一个显示线条颜色),我需要将它们合并成一个图例,显示线型和颜色。【有第三个图例显示'fill'对象,但没关系】
我按照这里给出的方法: Controlling line color and line type in ggplot legend 尝试获取单个图例,但最终得到了这种双重图例的行为,我做错了什么?
library(ggplot2)
library(scales)
data = structure(list(Dates = structure(c(1351713600, 1351717200, 1351720800,
1351724400, 1351728000, 1351731600), class = c("POSIXct", "POSIXt"
), tzone = "MST"), CumHVAC_Def_Stoch_Min = c(146.4006, 146.6673,
146.9336, 147.1996, 147.4648, 147.5964), CumHVAC_Def_Stoch_1st = c(188.0087,
188.2753, 188.5416, 188.8077, 189.0729, 189.2045),
CumHVAC_Def_Stoch_Mean = c(204.7234, 204.9901, 205.2564, 205.5225, 205.7876, 205.9193),
CumHVAC_Def_Stoch_3rd = c(228.8813, 229.1476, 229.4135, 229.6793, 229.9442, 230.0757),
CumHVAC_Def_Stoch_Max = c(295.145, 295.4117, 295.6779, 295.944, 296.2092, 296.3408),
CumHVAC_Opt_Stoch_Min = c(112.4095, 112.6761, 112.9424, 113.2085, 113.4737, 113.6053),
CumHVAC_Opt_Stoch_1st = c(134.8893,135.156, 135.4223, 135.6883, 135.9535, 136.0851),
CumHVAC_Opt_Stoch_Mean = c(156.8854, 157.1521, 157.4184, 157.6845, 157.9496, 158.0813),
CumHVAC_Opt_Stoch_3rd = c(168.7301, 168.9971, 169.2636, 169.5299, 169.7953, 169.927),
CumHVAC_Opt_Stoch_Max = c(241.2483, 241.5151, 241.7814, 242.0476, 242.3128, 242.4444),
CumHVAC_Def_Dtrmn = c(188.7523, 189.0189, 189.2852, 189.5513, 189.8165, 189.9481),
CumHVAC_Opt_Dtrmn = c(86.8116, 87.0782, 87.3445, 87.6105, 87.8757, 88.0073),
CS_Opt_Stoch = c(0, 0, 0, 0, 0, 0), CS_Opt_Dtrmn = c(0, 0, 0, 0, 0, 0),
CS_Default = c(0, 0, 0, 0, 0, 0)), .Names = c("Dates", "CumHVAC_Def_Stoch_Min",
"CumHVAC_Def_Stoch_1st", "CumHVAC_Def_Stoch_Mean", "CumHVAC_Def_Stoch_3rd",
"CumHVAC_Def_Stoch_Max", "CumHVAC_Opt_Stoch_Min",
"CumHVAC_Opt_Stoch_1st","CumHVAC_Opt_Stoch_Mean", "CumHVAC_Opt_Stoch_3rd",
"CumHVAC_Opt_Stoch_Max", "CumHVAC_Def_Dtrmn", "CumHVAC_Opt_Dtrmn", "CS_Opt_Stoch",
"CS_Opt_Dtrmn", "CS_Default"), row.names = 691:696, class = "data.frame")
stochdefcolor = 'red'
stochoptcolor = 'green'
dtrmndefcolor = 'darkred'
dtrmnoptcolor = 'darkgreen'
eb09 <- aes(x = Dates, ymax = CumHVAC_Def_Stoch_3rd, ymin = CumHVAC_Def_Stoch_1st, fill="StochDef")
eb10 <- aes(x = Dates, ymax = CumHVAC_Opt_Stoch_3rd, ymin = CumHVAC_Opt_Stoch_1st, fill="StochOpt")
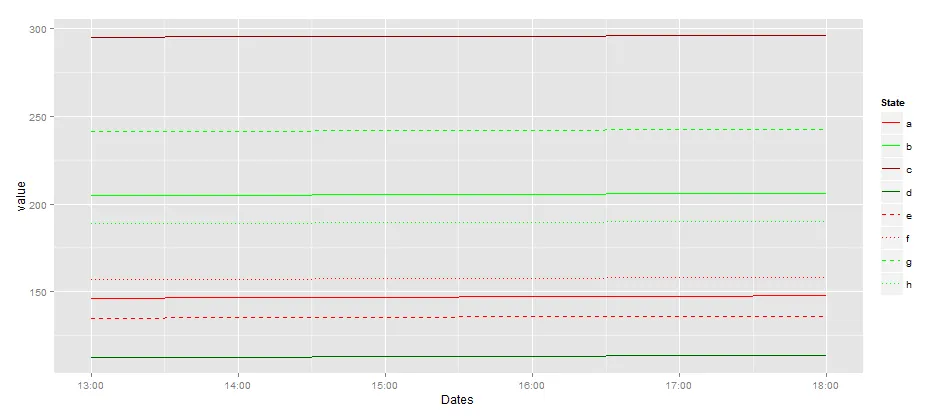
State = c('a','b','c','d','e','f','g','h');
ln1 <- aes(x=Dates,y=CumHVAC_Def_Stoch_Mean, color=State[1],linetype=State[1])
ln2 <- aes(x=Dates,y=CumHVAC_Opt_Stoch_Mean, color=State[2],linetype=State[2])
ln3 <- aes(x=Dates,y=CumHVAC_Def_Dtrmn,color=State[3],linetype=State[3])
ln4 <- aes(x=Dates,y=CumHVAC_Opt_Dtrmn,color=State[4],linetype=State[4])
ln5 <- aes(x=Dates,y=CumHVAC_Def_Stoch_Max,color=State[5],linetype=State[5])#,linetype = 2]
ln6 <- aes(x=Dates,y=CumHVAC_Def_Stoch_Min,color=State[6],linetype=State[6])#,linetype = 3)
ln7 <- aes(x=Dates,y=CumHVAC_Opt_Stoch_Max,color=State[7],linetype=State[7])#,linetype = 2)
ln8 <- aes(x=Dates,y=CumHVAC_Opt_Stoch_Min,color=State[8],linetype=State[8])#,linetype = 3)
quartz()
ggplot(data) +
geom_ribbon(eb09, alpha=0.4) +
geom_ribbon(eb10, alpha=0.4) +
geom_line(ln1,size=1) +
geom_line(ln2,size=1) +
geom_line(ln3,size=1) +
geom_line(ln4,size=1) +
geom_line(ln5,size=.7) +
geom_line(ln6,size=.7) +
geom_line(ln7,size=.7) +
geom_line(ln8,size=.7) +
xlab("X-lab") +
ylab("Y-Lab") +
opts(title = expression('Dummy Title'),
panel.background = theme_rect(fill = "transparent"),
panel.grid.minor = theme_blank(),
panel.grid.major = theme_blank(),
plot.background = theme_rect(fill = "transparent")) +
scale_linetype_manual(values=c(1,1,1,1,2,3,2,3)) +
scale_colour_manual(name=c("Lines"),
values=c(stochdefcolor,
stochoptcolor,
dtrmndefcolor,
dtrmnoptcolor,
stochdefcolor,
stochdefcolor,
stochoptcolor,
stochoptcolor)) +
scale_fill_manual(name='1st-3rd Quartiles',
breaks=c('StochDef','StochOpt'),
values=c(stochdefcolor,stochoptcolor),
labels=c('Stoch DEF','Stoch OPT'))
由于我是一个新用户,无法发布图片...