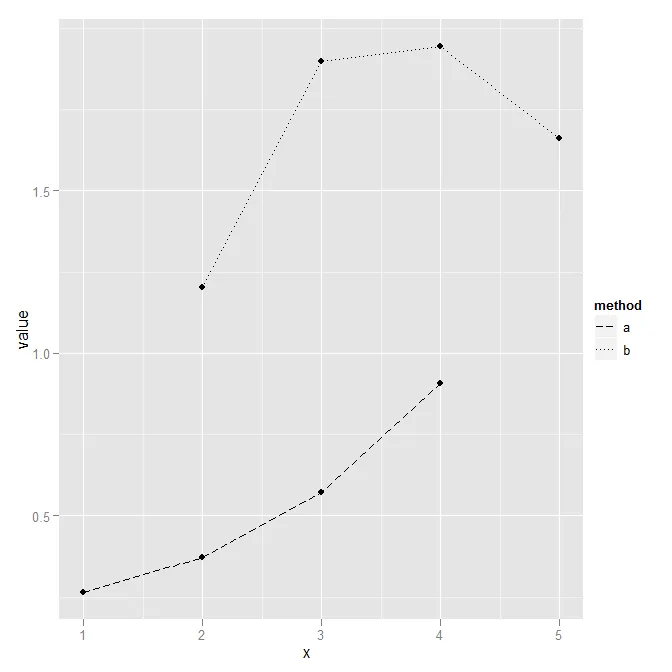
我想要调整以下ggplot中的线型。因此,我在数据框df中引入了另一列来表示线型,但一旦将其转换为因子,图例中出现了代表线型而非“方法”的线型(参见Trial 3)。
我该如何在图例中获取“method”?最终我希望能够:
- 自由选择线型,
- 自由选择这些线型在图例中出现的顺序,和
- 将相应的“method”显示为图例文本。
以下是我的尝试:
require(ggplot2)
set.seed(1)
df <- data.frame(x=c(1:4, 2:5),
                 method=rep(c("a", "b"), each=4),
                 lt=rep(c(5,3), each=4),
                 value=rep(c(0,1), each=4)+runif(8))

## trial 1:
ggplot(df, aes(x=x, y=value)) +
   geom_point() +
   geom_line(aes(group=method, linetype=method))
# fine, but not the linetypes I would like to have

## trial 2:
ggplot(df, aes(x=x, y=value)) +
   geom_point() +
   geom_line(aes(group=method, linetype=lt))
# correct linetypes, but no legend

## trial 3:
ggplot(df, aes(x=x, y=value)) +
   geom_point() +
   geom_line(aes(group=method, linetype=as.factor(lt)))
# legend, but not the correct one (I would like to have the "group"ing
# variable "method" in the legend as in trial 1)