控制ggplot2图例显示顺序

89

请问有谁知道如何控制ggplot2中图例的顺序吗?

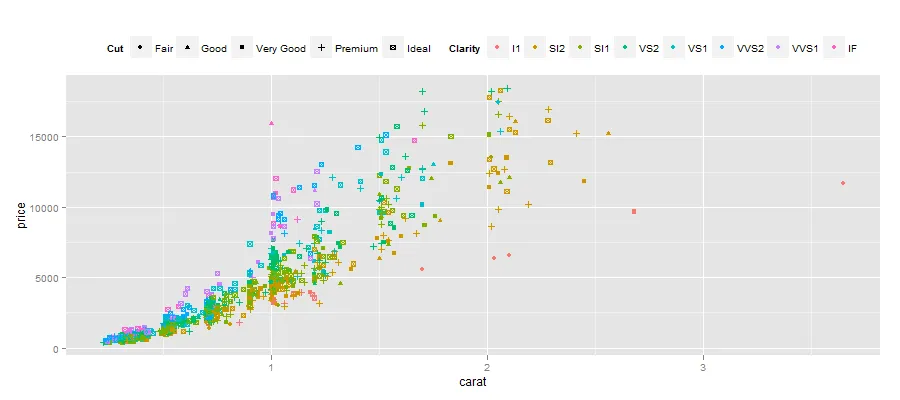
据我所见,图例的顺序似乎与实际比例标签相关,而不是比例声明顺序。更改比例标题会更改顺序。我使用钻石数据集制作了一个小例子来说明这一点。我想在一系列图中使用ggplot2,并希望其中一个变量始终出现在右侧。然而目前仅在其中一些图中发生这种情况,我不知道如何保持所需的顺序同时保留适当的比例标签。

library(ggplot2)
diamond.data <- diamonds[sample(nrow(diamonds), 1000), ]
plot <- ggplot(diamond.data, aes(carat, price, colour = clarity, shape = cut)) +
  geom_point() + opts(legend.position = "top", legend.box = "horizontal")
plot # the legend will appear shape then colour 
plot + labs(colour = "A", shape = "B") # legend will be colour then shape
plot + labs(colour = "Clarity", shape = "Cut") # legend will be shape then colour
2
相关内容(虽然这个问题有更好的解决方案):https://dev59.com/O2kw5IYBdhLWcg3wPIJ7 - Brian Diggs
2个回答

151

在0.9.1版本中,确定图例排序规则的方法是秘密不可预测的。 现在,在Github上的0.9.2开发版本中,您可以使用参数来设置图例的顺序。

以下是示例:

plot <- ggplot(diamond.data, aes(carat, price, colour = clarity, shape = cut)) +
  geom_point() + opts(legend.position = "top")

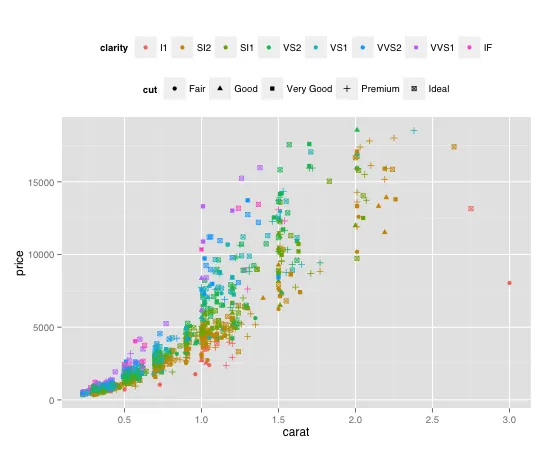
plot + guides(colour = guide_legend(order = 1), 
              shape = guide_legend(order = 2))

在此输入图片描述

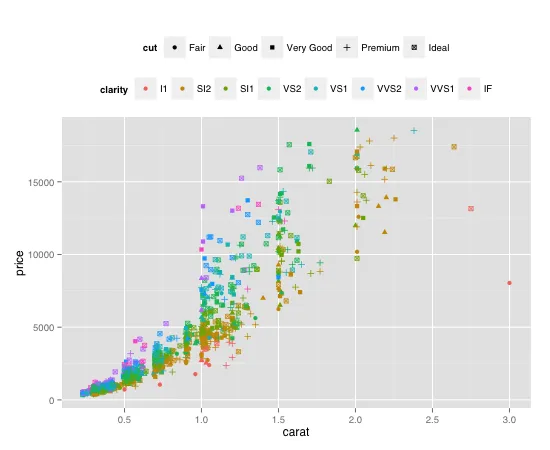
plot + guides(colour = guide_legend(order = 2), 
              shape = guide_legend(order = 1))

这里输入图像描述


15

在我看来,图例的顺序是由比例尺名称中字符数来确定的。(是的,我同意,这似乎很奇怪。)

因此,一种解决方法是用空格填充标签:

plot + labs(colour = "Clarity", shape = "      Cut")

输入图片描述


我真诚地希望很快有人发布一个合适的解决方案!


1
如果我按照你的方法操作,就可以在图例中获得清晰度并进行裁剪(用空格填充)。packageDescription("ggplot2")$Version = 0.9.1 - Spacedman
我应该明确表明,我实际上想要的是颜色而不是形状(即先看清晰度再看切割),而不是像您的例子那样先看切割再看清晰度。然而,我希望能够给这些尺度任何名称,并仍然拥有相同的排序。 - Alastair
4
现在很明显,我的解决方法只适用于ggplot2的0.9.0版本,这种方法在0.9.1版本中已经不再适用。因此,如果您仍在使用0.9.0版本,您可以通过在字符串中填充空格来实现所需的顺序。正如我所说,这只是一个解决方法(而且寿命有限)。 - Andrie

网页内容由stack overflow 提供, 点击上面的
可以查看英文原文,
原文链接