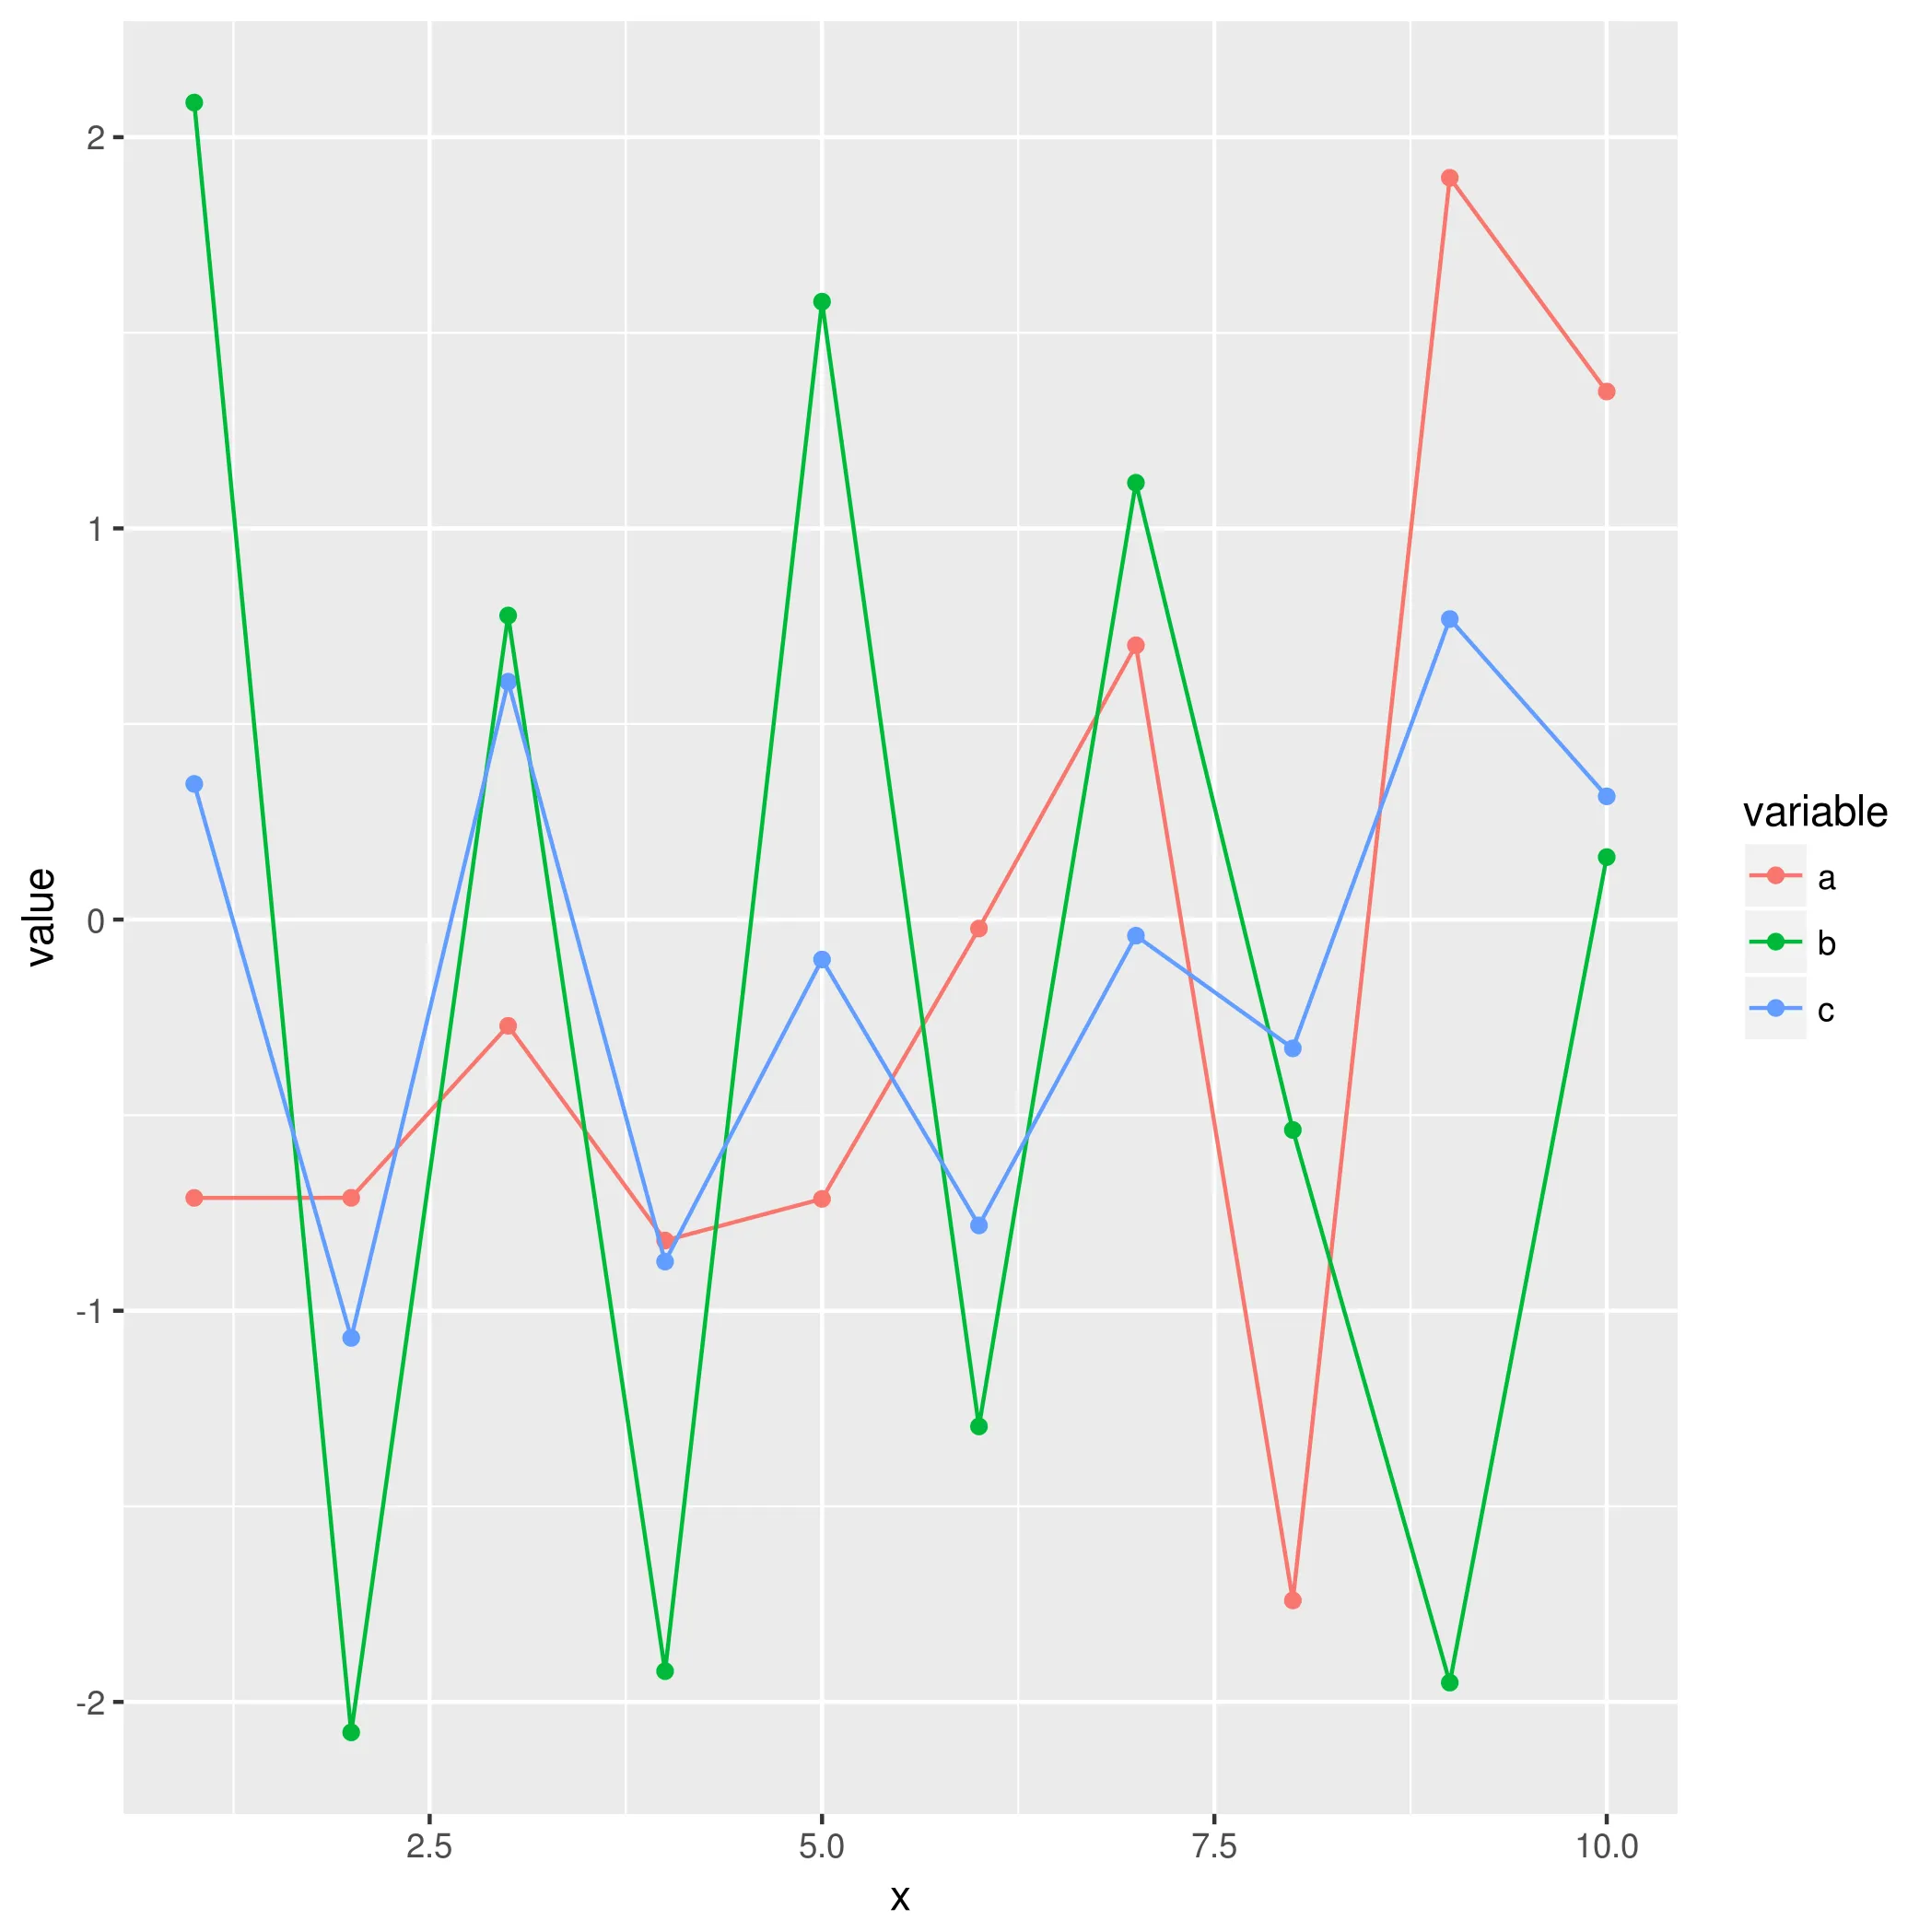
我试图在我的R ggplot2图表中展示一个涉及多个绘图的图例,但是没有成功。以下是我的数据框df和代码:
  Individuals        Mod.2        Mod.1          Mod.3
1           2 -0.013473145  0.010859793    -0.08914021
2           3 -0.011109863  0.009503278    -0.09049672
3           4 -0.006465788  0.011304668    -0.08869533
4           5  0.010536718  0.009110458    -0.09088954
5           6  0.015501212  0.005929766    -0.09407023
6           7  0.014565584  0.005530390    -0.09446961
7           8 -0.009712516  0.012234843    -0.08776516
8           9 -0.011282278  0.006569570    -0.09343043
9          10 -0.011330579  0.003505439    -0.09649456

str(df)
    'data.frame':   9 obs. of  4 variables:
     $ Individuals   : num  2 3 4 5 6 7 8 9 10
     $ Mod.2         : num  -0.01347 -0.01111 -0.00647 0.01054 0.0155 ...
     $ Mod.1         : num  0.01086 0.0095 0.0113 0.00911 0.00593 ...
     $ Mod.3         : num  -0.0891 -0.0905 -0.0887 -0.0909 -0.0941 ...

ggplot(df, aes(df$Individuals)) +
    geom_point(aes(y=df[,2]), colour="red") + geom_line(aes(y=df[,2]), colour="red") +
    geom_point(aes(y=df[,3]), colour="lightgreen") + geom_line(aes(y=df[,3]), colour="lightgreen") +
    geom_point(aes(y=df[,4]), colour="darkgreen") + geom_line(aes(y=df[,4]), colour="darkgreen") +
    labs(title = "Modules", x = "Number of individuals", y = "Mode")
我查阅了以下 Stackflow 帖子以及 Google 搜索结果:
- Merging ggplot2 legend
- ggplot2 legend not showing
- `ggplot2` legend not showing label for added series
- ggplot2 legend for geom_area/geom_ribbon not showing
- ggplot and R: Two variables over time
- ggplot legend not showing up in lift chart
- Why ggplot2 legend not show in the graph
- ggplot legend not showing up in lift chart。这个帖子是在4天前发布的。
这让我意识到,尽管图例通常会自动出现,但让图例出现是一个反复出现的问题。
我的第一个问题是使用 ggplot 时图例没有出现的原因是什么?第二个问题是如何解决这些问题。其中一个原因似乎与多个图表和使用 aes() 有关,但我怀疑还有其他原因。
plot()语法。关键问题在于为ggplot准备数据框架。如果您提供数据框的部分内容,我很乐意帮忙。 - Joyvalley