如何将ggplot绘图标题居中

13

在ggplot中将图表标题居中的正确方法是使用plot.title = element_text(hjust = 0.5),它可以将标题居中于绘图区域但不包括轴标签。

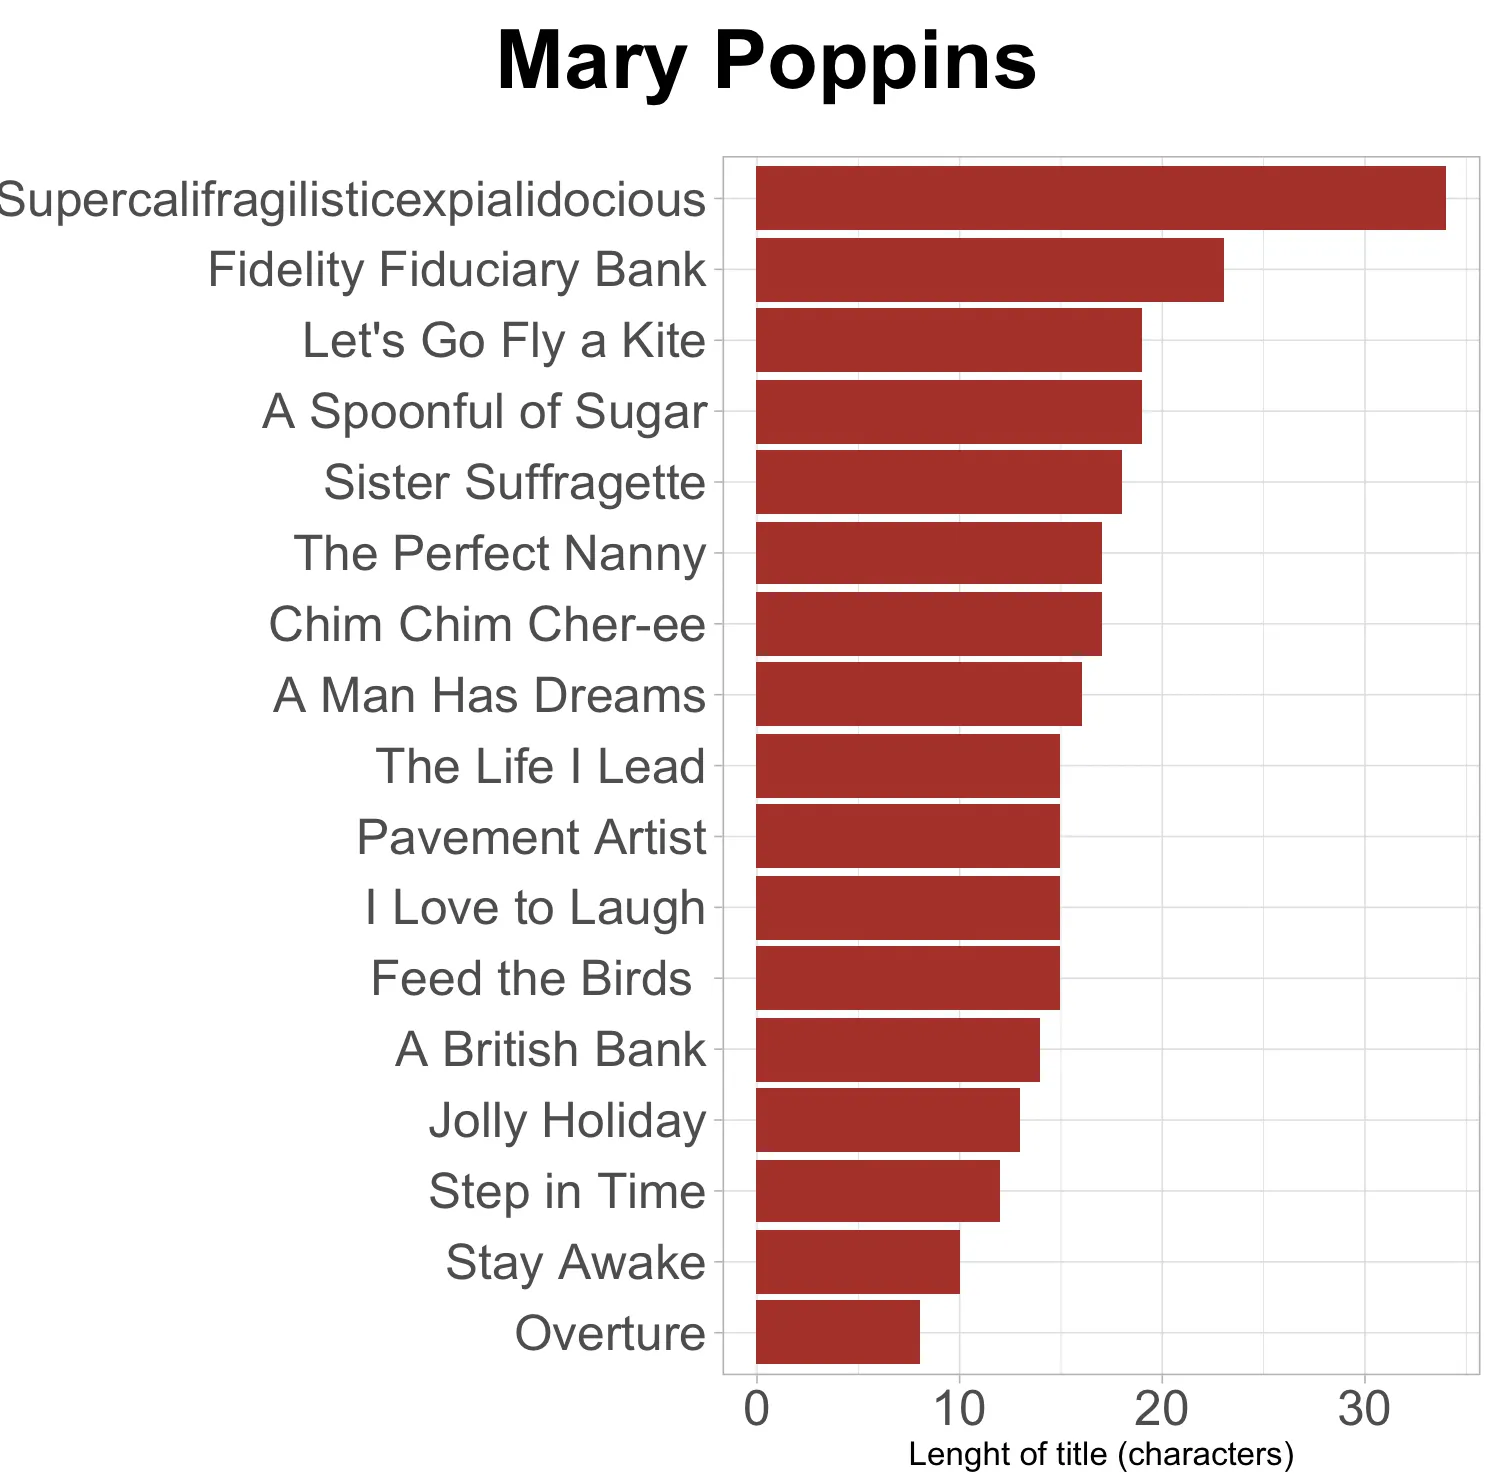
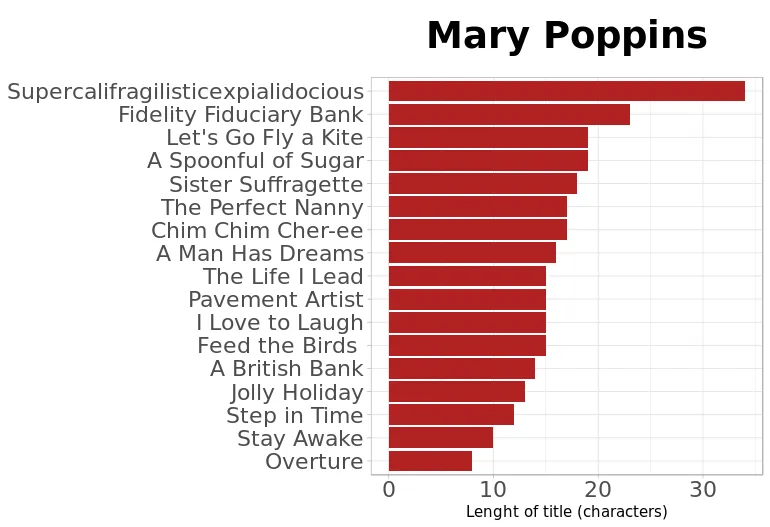
当轴标签非常长时,例如下面这张《炮弹与小鸟》原声带歌曲与其字符长度的图表,这种方法可能会出现问题。

炮弹与小鸟原声带中歌曲长度

library(tidyverse)

mary_poppins <- data_frame(song = c("Overture", "Sister Suffragette", "The Life I Lead", "The Perfect Nanny", "A Spoonful of Sugar", "Pavement Artist", "Jolly Holiday", "Supercalifragilisticexpialidocious", "Stay Awake", "I Love to Laugh", "A British Bank", "Feed the Birds ", "Fidelity Fiduciary Bank", "Chim Chim Cher-ee", "Step in Time", "A Man Has Dreams", "Let's Go Fly a Kite"
))

mary_poppins <- mary_poppins %>%
  mutate(len = nchar(song))

ggplot(data = mary_poppins, aes(x = reorder(song, len), y = len)) +
  geom_col(fill = "firebrick") +
  coord_flip() +
  theme_light() +
  theme(axis.title.y = element_blank(),
        axis.text = element_text(size = rel(1.5)),
        plot.title = element_text(size = rel(2.5), face = "bold", hjust = 0.5, 
                                  margin = margin(t = 10, b = 20, unit = "pt"))) +
  ggtitle("Mary Poppins") +
  ylab("Lenght of title (characters)")

有没有一种方法可以将标题居中放置在总绘图区域上,即包括轴标签占用的区域?

6个回答

8
解决这个问题的简单方法是将以下内容添加到绘图中:
theme(plot.title.position = 'plot', 
      plot.title = element_text(hjust = 0.5))

第一部分告诉ggplot使用整个图作为居中的参考,第二部分使标题居中。

6
我找到了一个简短的解决方案:
theme(plot.title = element_text(hjust = -0.2))

hjust参数控制左对齐到y轴的距离。负值将文本向左移动。


3

解决方案:添加空格以使标题居中:

使用以下方法在标题后添加空格:

ggtitle(paste0("Mary Poppins", paste0(rep("", 30), collapse = " ")))

对于这样的输出:

enter image description here

不是完美的解决方案,但可以工作。


3

或者,您可以使用gridExtra :: grid.arrangegrid :: textGrob创建标题,而无需在视觉上进行填充。这基本上创建了一个带有标题的单独绘图对象,并将其粘贴在顶部,与您的ggplot调用的内容无关。

首先将整个ggplot调用存储在一个变量中,例如p1

grid.arrange(textGrob("Mary Poppins", 
               gp = gpar(fontsize = 2.5*11, fontface = "bold")), 
             p1, 
             heights = c(0.1, 1))

你需要将theme()设置翻译为gpar()theme_light的基本大小为11,这就是2.5*11的来源(以及2.5来自于你的rel(2.5))。

enter image description here

这里的优点是您知道您的标题将会真正居中,而不只是通过肉眼看起来差不多。

谢谢 - 这确实比填充空格更整洁! - Jindra Lacko

2
正如我在本质上的重复问题中所回答的,您可以使用patchwork库及其plot_annotation,这样您就会有:
library(tidyverse)

mary_poppins <- data_frame(song = c("Overture", "Sister Suffragette", "The Life I Lead", "The Perfect Nanny", "A Spoonful of Sugar", "Pavement Artist", "Jolly Holiday", "Supercalifragilisticexpialidocious", "Stay Awake", "I Love to Laugh", "A British Bank", "Feed the Birds ", "Fidelity Fiduciary Bank", "Chim Chim Cher-ee", "Step in Time", "A Man Has Dreams", "Let's Go Fly a Kite"
))
mary_poppins <- mary_poppins %>%
  mutate(len = nchar(song))

ggplot(data = mary_poppins, aes(x = reorder(song, len), y = len)) +
  geom_col(fill = "firebrick") +
  coord_flip() +
  theme_light() +
  theme(axis.title.y = element_blank(),
        axis.text = element_text(size = rel(1.5))) +
  patchwork::plot_annotation("Mary Poppins", 
        theme = theme(plot.title = element_text(size = rel(2.5), face = "bold", hjust = 0.5, 
                                  margin = margin(t = 10, b = 20, unit = "pt")))) +
  ylab("Lenght of title (characters)")

由于plot_annotation是为多面板图设计的,它不会继承您正在构建的图的主题,因此您需要单独给出它。但是,它将遵守任何全局主题。
生成的图表(希望)是您所需要的。

plot with centered title


不是一个典型的{patchwork}使用案例,但它确实有效 - 感谢分享! - Jindra Lacko

1
如果您很着急,可以在ggtitle标题后添加空格即可解决问题...
ggtitle("Mary Poppins                                 ") +

输出:

输出: 中央玛丽·波平斯标题


网页内容由stack overflow 提供, 点击上面的
可以查看英文原文,
原文链接