默认情况下,ggplot标题与plot.background元素左对齐。其他人指出,您可以使用
是否有可能始终将ggplot的标题元素设置为在panel.background上居中?
plot.title = element_text(hjust = 0.5)来居中标题。
然而,我想要将标题居中到整个面板,而不仅仅是图表。我过去通过修改hjust的值来将标题居中,但是hjust的值取决于标题的长度,这使得批量生成图形时设置起来非常麻烦。是否有可能始终将ggplot的标题元素设置为在panel.background上居中?
library(reprex)
library(tidyverse)
data(mtcars)
mtcars %>%
rownames_to_column(var = "model") %>%
top_n(8,wt) %>%
ggplot(aes(x =model, y = wt))+
geom_col()+
coord_flip()+
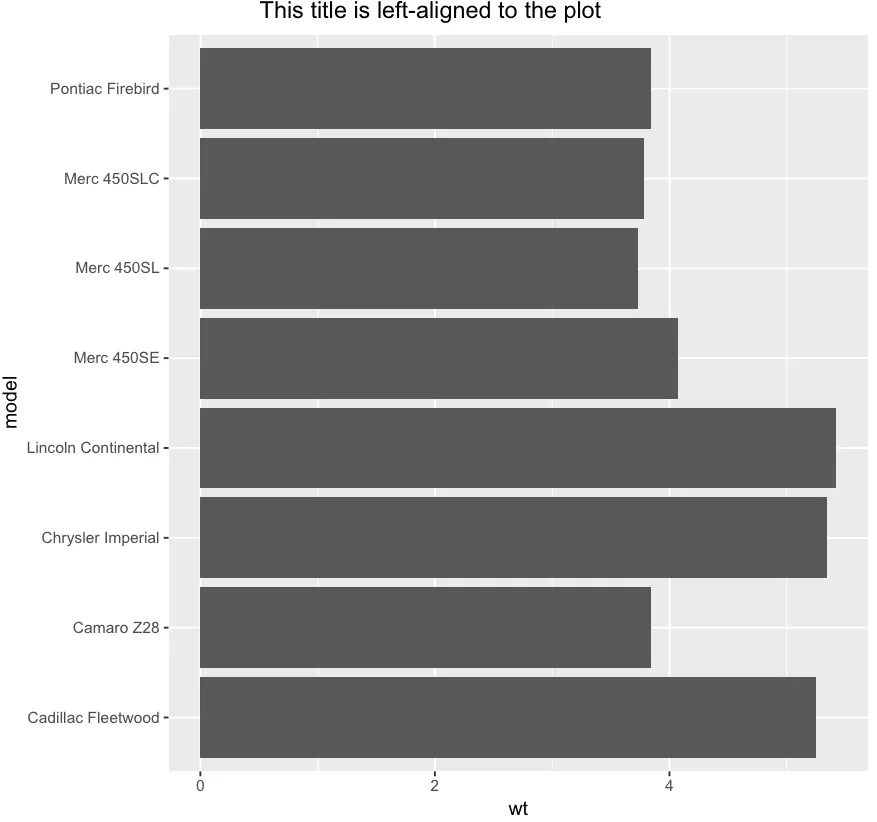
labs(title="This title is left-aligned to the plot")

mtcars %>%
rownames_to_column(var = "model") %>%
top_n(8,wt) %>%
ggplot(aes(x =model, y = wt))+
geom_col()+
coord_flip()+
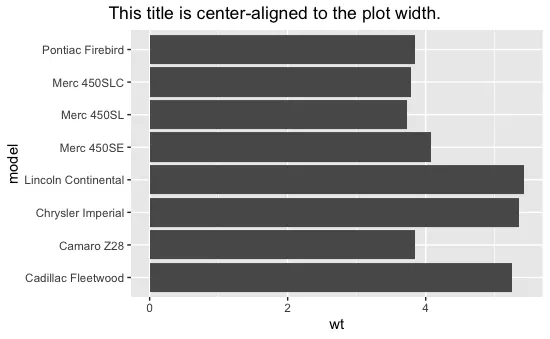
labs(title="This title is center-aligned to the plot width.")+
theme(plot.title = element_text(hjust = 0.5))

mtcars %>%
  rownames_to_column(var = "model") %>%
  top_n(8,wt) %>%
  ggplot(aes(x =model, y = wt))+
  geom_col()+
  coord_flip()+
  labs(title="Short title, still works")+
  theme(plot.title = element_text(hjust = 0.5))

mtcars %>%
  rownames_to_column(var = "model") %>%
  top_n(8,wt) %>%
  ggplot(aes(x =model, y = wt))+
  geom_col()+
  coord_flip()+
  labs(title="This title is roughly center-aligned to panel")+
  theme(plot.title = element_text(hjust = 0.37)) # I know I can adjust this, but it would require a manual fix each time

@user20650的建议
p <- mtcars %>%
rownames_to_column(var = "model") %>%
top_n(8,wt) %>%
ggplot(aes(x =model, y = wt))+
geom_col()+
coord_flip()+
#labs(title="Short title, still works")+
theme(plot.title = element_text(hjust = 0.5))
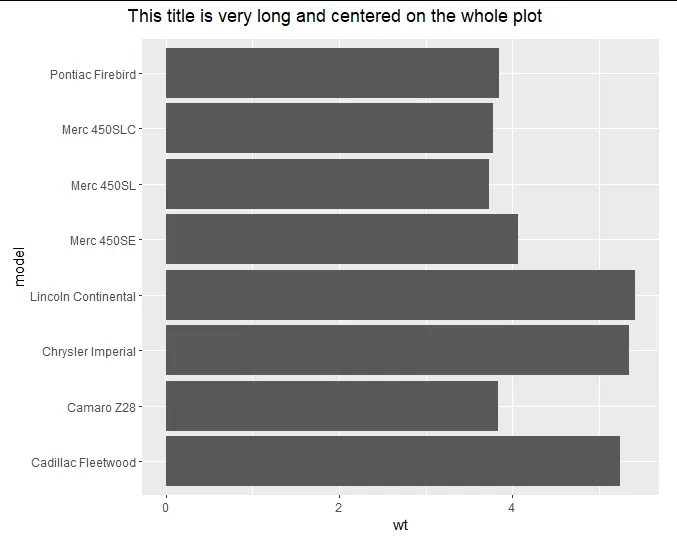
gridExtra::grid.arrange( top=grid::textGrob("This title is center-aligned to panel"),p )

该内容由reprex软件包(版本为v0.2.1)于2018年9月24日创建
gridExtra::grid.arrange( top=grid::textGrob("此标题大致居中对齐于面板"), p )- user20650gridExtra::grid.arrange(top=grid::textGrob("This title is roughly center-aligned to panel"), grid::textGrob("subtitle"), p ),textgrobs肯定在整个面板上居中,但是有很多垂直间距。有什么方法可以减少这个间距吗?理想情况下,我希望保持标题和副标题文本分开,以便我可以以不同的方式进行样式设置。 - grad_studentgrid.arrange( top=grobTree(textGrob("这个标题"), textGrob("\n\n这个副标题", gp=gpar(cex=0.8))), p, padding=unit(2, "line")):不确定在增加标题字体大小等方面会有多强的稳健性。 - user20650