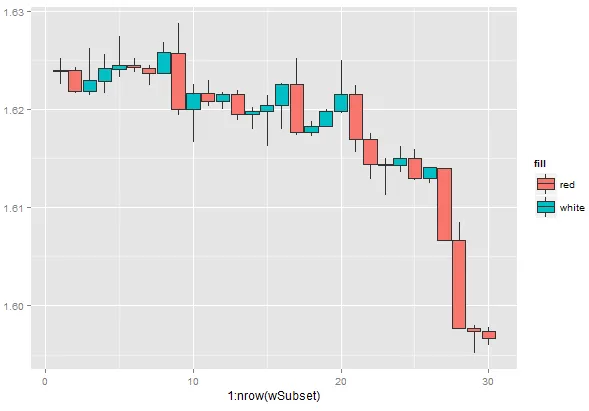
我有一个名为wSubset的R数据框。我在问题底部提供了此数据框的dput。我可以使用以下代码行生成蜡烛图而没有问题:
if(!require("ggplot2")) { install.packages("ggplot2");  require("ggplot2") }
g <- ggplot(data=wSubset, aes(x=1:nrow(wSubset), lower=wSubset$candleLower, middle=wSubset$candleMiddle,
                         upper=wSubset$candleUpper, ymin=wSubset$low, ymax=wSubset$high)) +
      geom_boxplot(stat='identity', aes(group=datetime, fill=fill))
现在,我还将1到5的类信息存储在wSubset$cluster中。 我想在上面的g上叠加一个geom_ribbon以对不同区域进行颜色标记。
# the dataframe to be used by the geom_ribbon for colour-labelling
df_bg2 <- data.frame(x = c(0, rep(which(as.logical(diff(wSubset$cluster))), each=2), length(wSubset$cluster)),
                     ymin = min(scale(wSubset$low), na.rm = TRUE),
                     ymax = 1.1*max(scale(wSubset$high), na.rm = TRUE),
                     fill = factor(rep(wSubset$cluster[c(which(as.logical(diff(wSubset$cluster))),
                                                             length(wSubset$cluster) )], each=2)),
                     grp = factor(rep(seq(sum(as.logical(diff(wSubset$cluster)), na.rm=TRUE)+1), each=2))
                     )

# new plot which has candlesticks and the geom_ribbon colour-labelling
g2 <- ggplot(data=wSubset, aes(x=1:nrow(wSubset), lower=wSubset$candleLower, middle=wSubset$candleMiddle,
                         upper=wSubset$candleUpper, ymin=wSubset$low, ymax=wSubset$high)) +
      geom_boxplot(stat='identity', aes(group=datetime, fill=fill)) +
      geom_ribbon(data = df_bg2, aes(x = x, ymin=ymin, ymax=ymax, fill=fill, group=grp), alpha=.2) +
      xlab("Date-Time") +
      ylab("Levels") +
      labs(title = "States in Temporal Display")
在这里,df_bg2用于填充几何形状的带区域,并且当我使用geom_line时可以正常工作,但是当我尝试将geom_boxplot与geom_ribbon混合使用时会出现以下错误:
错误:美学必须是长度为一或与数据相同长度Problems:wSubset$candleLower、wSubset$candleMiddle、wSubset$candleUpper
你有什么想法吗?这个问题与我的早期问题有关,该问题是关于如何使用geom_ribbon的。
> dput(wSubset)
structure(list(date = structure(c(16342, 16342, 16342, 16342,
16342, 16342, 16343, 16343, 16343, 16343, 16343, 16343, 16344,
16344, 16344, 16344, 16344, 16344, 16345, 16345, 16345, 16345,
16345, 16345, 16346, 16346, 16346, 16346, 16346, 16346), class = "Date"),
    datetime = structure(c(1411945200, 1411959600, 1411974000,
    1411988400, 1412002800, 1412017200, 1412031600, 1412046000,
    1412060400, 1412074800, 1412089200, 1412103600, 1412118000,
    1412132400, 1412146800, 1412161200, 1412175600, 1412190000,
    1412204400, 1412218800, 1412233200, 1412247600, 1412262000,
    1412276400, 1412290800, 1412305200, 1412319600, 1412334000,
    1412348400, 1412362800), class = c("POSIXct", "POSIXt"), tzone = ""),
    open = c(1.62383, 1.62398, 1.62182, 1.62289, 1.62408, 1.62449,
    1.6242, 1.62363, 1.62573, 1.62001, 1.62161, 1.62084, 1.62149,
    1.61949, 1.61978, 1.62036, 1.62253, 1.61767, 1.61825, 1.61978,
    1.62157, 1.61697, 1.61439, 1.6143, 1.61496, 1.61294, 1.61403,
    1.60669, 1.59768, 1.59739), high = c(1.62517, 1.62426, 1.62618,
    1.62559, 1.62745, 1.62522, 1.6245, 1.62678, 1.62873, 1.62253,
    1.62297, 1.62175, 1.62194, 1.62018, 1.6214, 1.62261, 1.62521,
    1.61873, 1.61999, 1.625, 1.62248, 1.61756, 1.615, 1.61624,
    1.61591, 1.61405, 1.61403, 1.60844, 1.598, 1.5978), low = c(1.62258,
    1.62166, 1.62143, 1.62162, 1.6233, 1.62375, 1.62247, 1.62361,
    1.61936, 1.61664, 1.62026, 1.61998, 1.61886, 1.61792, 1.61618,
    1.61798, 1.61739, 1.61724, 1.61817, 1.61962, 1.61561, 1.61283,
    1.61126, 1.61358, 1.6128, 1.61248, 1.60665, 1.59769, 1.59518,
    1.59594), close = c(1.62401, 1.62184, 1.6229, 1.62412, 1.62448,
    1.62422, 1.62365, 1.62575, 1.62002, 1.6216, 1.62085, 1.62149,
    1.61948, 1.61979, 1.62036, 1.62256, 1.61769, 1.61826, 1.61978,
    1.62153, 1.61698, 1.61435, 1.61429, 1.61496, 1.61294, 1.61405,
    1.60669, 1.59769, 1.5974, 1.59672), candleLower = c(1.62383,
    1.62184, 1.62182, 1.62289, 1.62408, 1.62422, 1.62365, 1.62363,
    1.62002, 1.62001, 1.62085, 1.62084, 1.61948, 1.61949, 1.61978,
    1.62036, 1.61769, 1.61767, 1.61825, 1.61978, 1.61698, 1.61435,
    1.61429, 1.6143, 1.61294, 1.61294, 1.60669, 1.59769, 1.5974,
    1.59672), candleMiddle = c(NA, NA, NA, NA, NA, NA, NA, NA,
    NA, NA, NA, NA, NA, NA, NA, NA, NA, NA, NA, NA, NA, NA, NA,
    NA, NA, NA, NA, NA, NA, NA), candleUpper = c(1.62401, 1.62398,
    1.6229, 1.62412, 1.62448, 1.62449, 1.6242, 1.62575, 1.62573,
    1.6216, 1.62161, 1.62149, 1.62149, 1.61979, 1.62036, 1.62256,
    1.62253, 1.61826, 1.61978, 1.62153, 1.62157, 1.61697, 1.61439,
    1.61496, 1.61496, 1.61405, 1.61403, 1.60669, 1.59768, 1.59739
    ), fill = c("white", "red", "white", "white", "white", "red",
    "red", "white", "red", "white", "red", "white", "red", "white",
    "white", "white", "red", "white", "white", "white", "red",
    "red", "red", "white", "red", "white", "red", "red", "red",
    "red"), cluster = c(5, 4, 2, 2, 2, 5, 5, 2, 4, 2, 5, 5, 4,
    5, 4, 2, 4, 1, 1, 2, 4, 4, 4, 5, 4, 5, 3, 3, 5, 5)), .Names = c("date",
"datetime", "open", "high", "low", "close", "candleLower", "candleMiddle",
"candleUpper", "fill", "cluster"), row.names = c(NA, 30L), class = "data.frame")
wSubset$datetime作为x轴?我认为不行,因为df_bg2没有该列。 - Zhubarbaes。我会像这里一样,将该列添加到wSubset中。 - Matthew Plourdedf_bg2中使用它。 - Matthew Plourde