有没有办法在R中将plot函数生成的图和ggplot函数生成的图放在同一页并排显示?
使用par或multiplot函数可以轻松地将同一函数创建的图放在一个页面上,但我无法解决上述问题。
你可以使用gridBase包和viewPorts来实现这一点。
library(grid)
library(gridBase)
library(ggplot2)
# start new page
plot.new()
# setup layout
gl <- grid.layout(nrow=1, ncol=2)
# grid.show.layout(gl)
# setup viewports
vp.1 <- viewport(layout.pos.col=1, layout.pos.row=1)
vp.2 <- viewport(layout.pos.col=2, layout.pos.row=1)
# init layout
pushViewport(viewport(layout=gl))
# access the first position
pushViewport(vp.1)
# start new base graphics in first viewport
par(new=TRUE, fig=gridFIG())
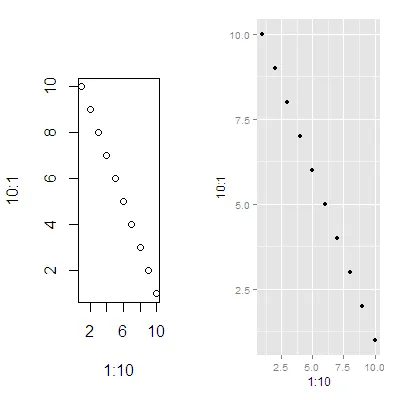
plot(x = 1:10, y = 10:1)
# done with the first viewport
popViewport()
# move to the next viewport
pushViewport(vp.2)
ggplotted <- qplot(x=1:10,y=10:1, 'point')
# print our ggplot graphics here
print(ggplotted, newpage = FALSE)
# done with this viewport
popViewport(1)
这个示例是这篇博客文章的修改版,原作者为Dylan Beaudette。
是的。它们都是基于网格的图形系统,并返回图形对象。请查看gridExtra包中的grid.arrange函数。
gridExtra包。我认为它可以做到这一点。 - Justin