在筛选底层数据框之后,如何将变量的值分配给ggplot标题。
library(tidyverse)
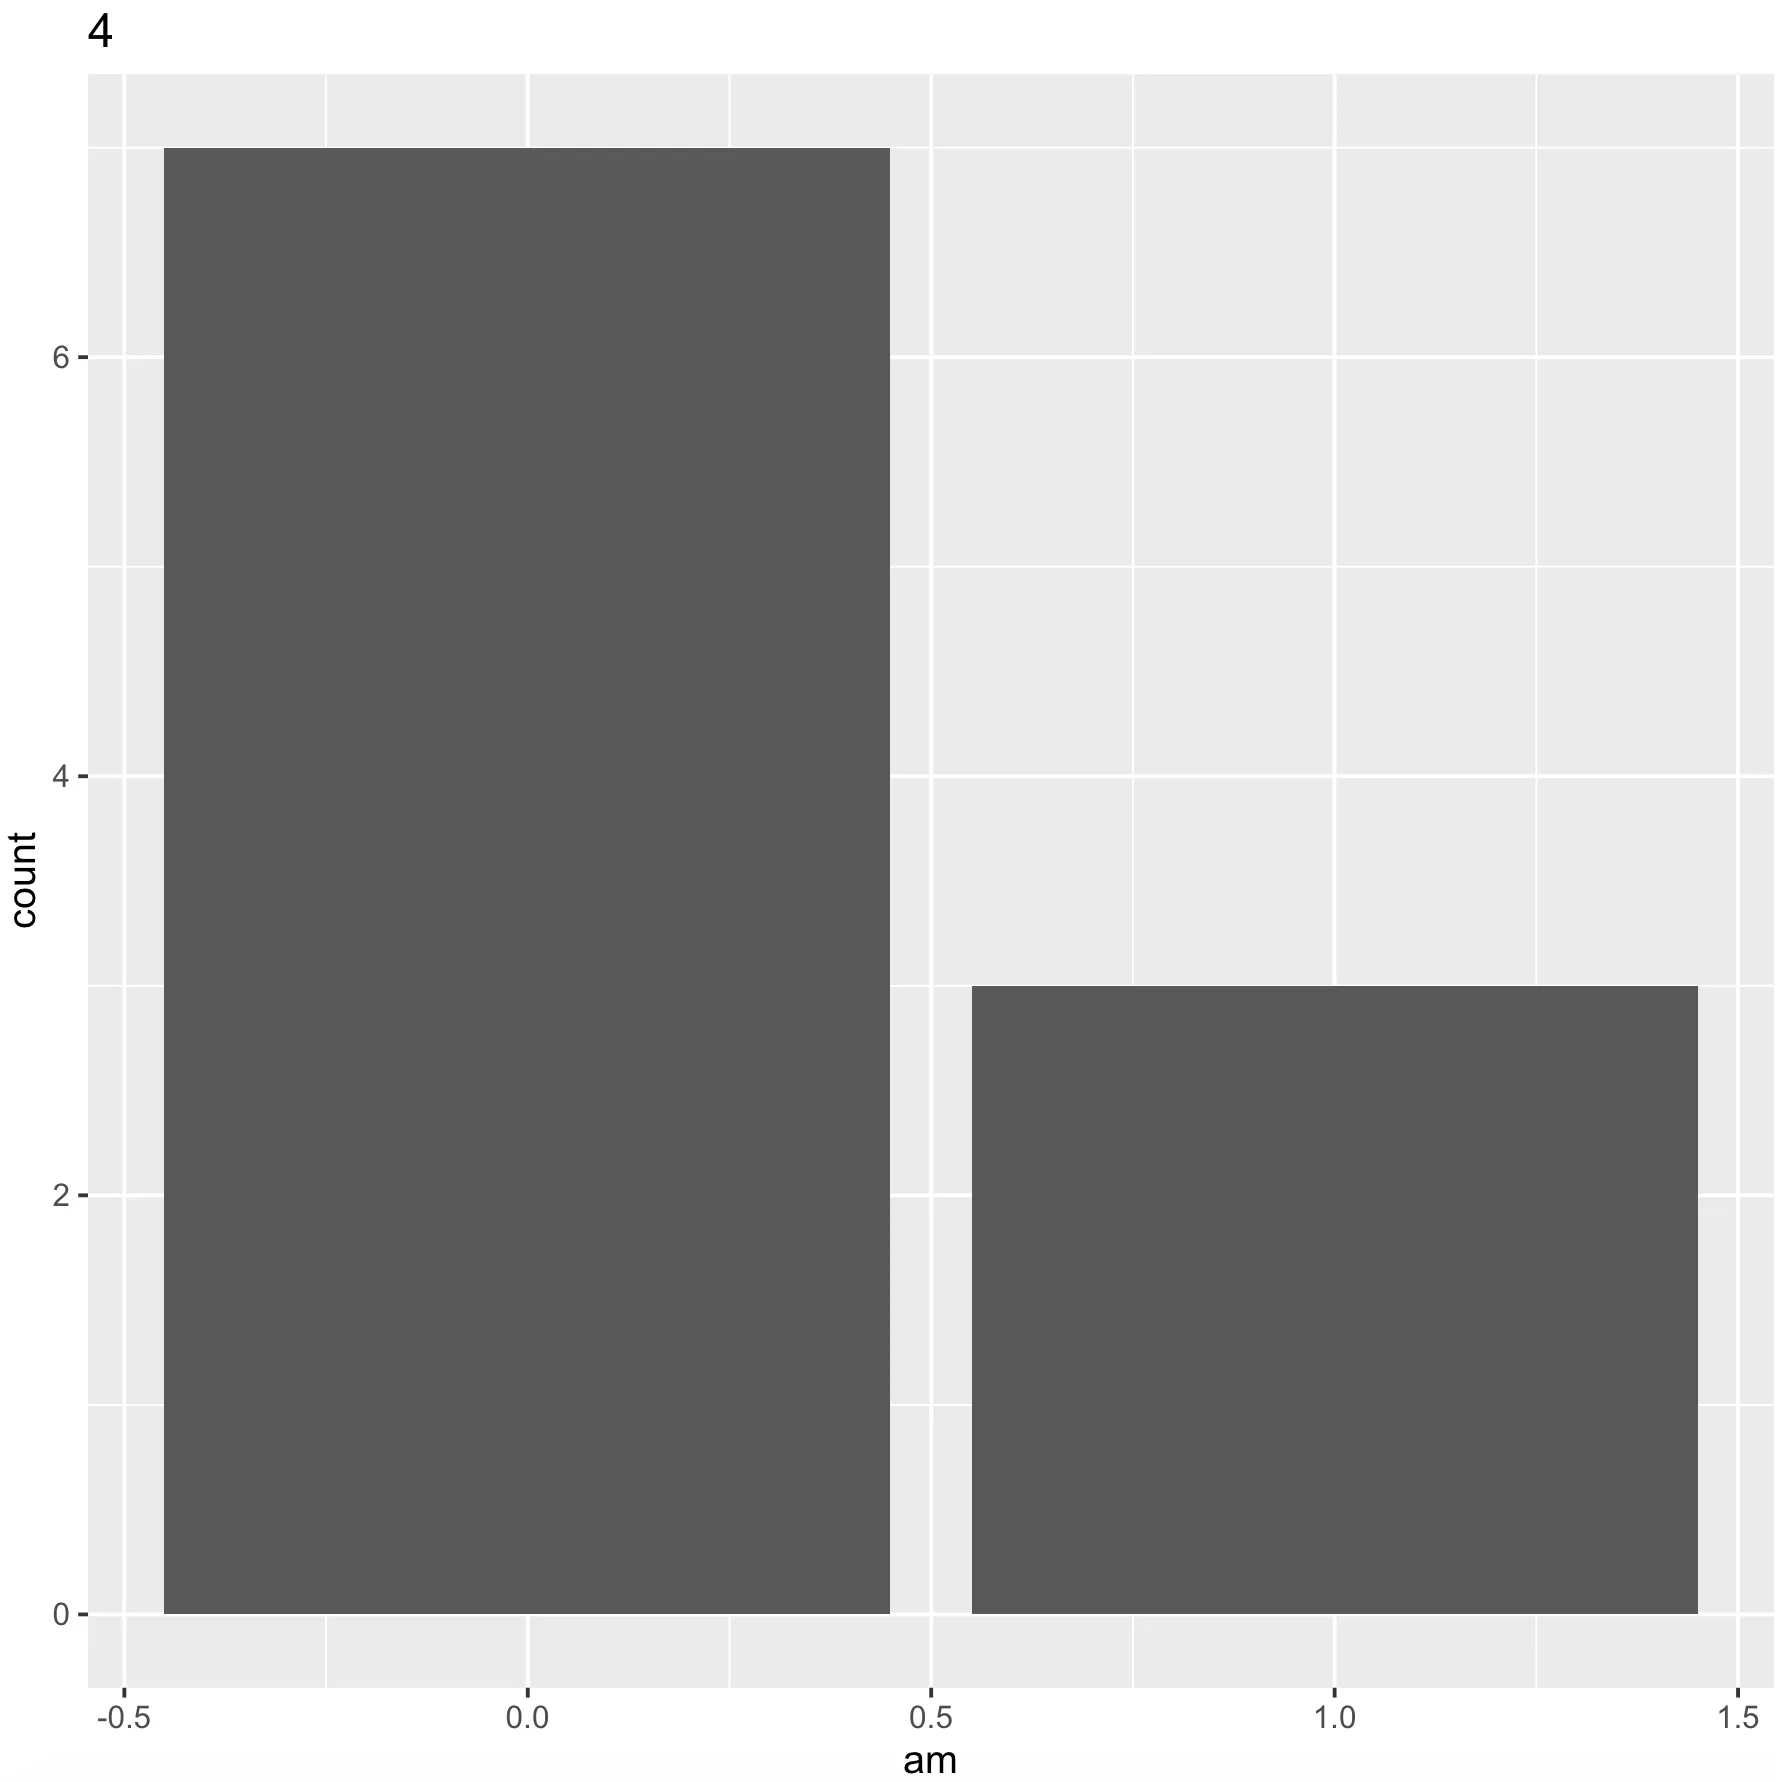
#THIS WORKS
d <- mtcars %>%
filter(carb==4)
d %>%
ggplot()+
labs(title=paste(unique(d$carb)))+
geom_bar(aes(x=am,
fill=gear),
stat="count")

#THIS DOESN'T WORK

mtcars %>%
  filter(carb==4) %>%
  ggplot()+
  labs(title=paste(data=. %>% distinct(carb) %>% pull()))+
  geom_bar(aes(x=am,
               fill=gear),
           stat="count")
#> Error in as.vector(x, "character"): cannot coerce type 'closure' to vector of type 'character'

#THIS ALSO DOESN'T WORK

mtcars %>%
  filter(carb==3) %>%
  ggplot()+
  labs(title=paste(.$carb))+
  geom_bar(aes(x=am,
               fill=gear),
           stat="count")
#> Error in paste(.$carb): object '.' not found
此代码片段由 reprex包 (v0.3.0) 于2020-04-23创建。
filter步骤的输出分配给一个新对象,例如d1 <- mtcars %>% filter(carb==4),那么就可以更容易地理解了。然后只需使用ggplot(d1, aes(x = am, fill = gear)) + geom_bar(stat = 'count') + labs(title = unique(d1$carb))即可。将其包装在{}中可以将其视为单个块,并且我们可以从前一步骤提取列的值,即'carb'列。 - akrun