我希望您能在图片上绘制点:
我有以下数据框:
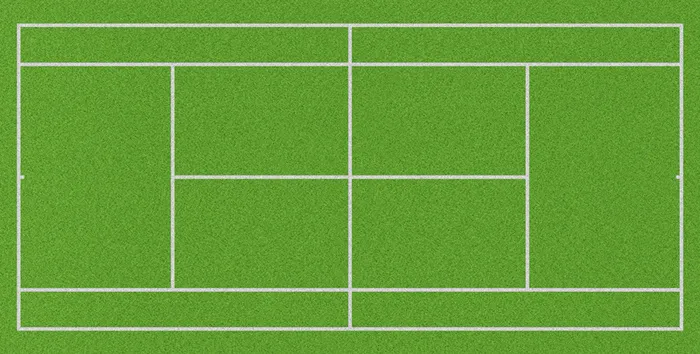
以下是一张图片 - 网球场。
以下代码用于绘制图片。
这个可以用,但我想把点绘制在特定的区域上。比如说,我想在球场右侧的左侧服务区域绘制它。
有什么想法可以将图片的特定部分分类,以便在该区域绘制点吗?
我有以下数据框:
x <- c(1,2)
y <- c(10,12)
df <- data.frame(x,y
以下是一张图片 - 网球场。
img <- readJPEG("tennis_court.jpg")
以下代码用于绘制图片。
 ggplot(df, aes(x,y)) +
 annotation_custom(rasterGrob(img, width=unit(1,"npc"), height=unit(1,"npc")),
                   -Inf, Inf, -Inf, Inf) +
 stat_bin2d() +
 scale_x_continuous(expand=c(0,0)) +
 scale_y_continuous(expand=c(0,0))
这个可以用,但我想把点绘制在特定的区域上。比如说,我想在球场右侧的左侧服务区域绘制它。
有什么想法可以将图片的特定部分分类,以便在该区域绘制点吗?
+ geom_point(size=10, shape=15, color="red")来绘制大的红色正方形。 - lukeA