使用ChartJS 2.4,我正在查询两个日期之间的一组记录:
给定比例配置,我想以用户选择的日期范围开始一周...
除了这样笨拙地将图表向后延长一周且没有数据外... 而且不会从
如果删除
      startDate: '2016-11-05T18:06:17.762Z'
      endDate: '2016-12-05T18:06:17.762Z'
给定比例配置,我想以用户选择的日期范围开始一周...
 isoWeekday: true,
 type: 'time',
 unitStepSize: 1,
 time: {
   displayFormats: {
     'week': 'MMM DD'
   },
   unit: 'week',
 },
这会导致我得到一个截断的图表:
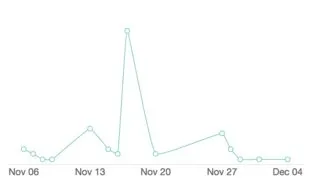
因此,如果没有记录返回给开始日期11/5,我会手动在数组开头插入一个值为0的数据,以确保显示用户期望的开始日期:
  if (scope.chart_data.labels.indexOf('11/5') == -1) {
    scope.chart_data.labels.unshift('11/5');
    scope.chart_data.datasets[0].data.unshift(0);
  }
除了这样笨拙地将图表向后延长一周且没有数据外... 而且不会从
11/5开始这个星期:
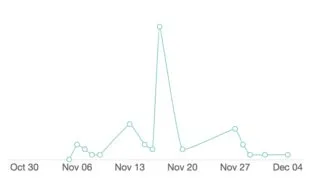
unit: week配置从那里递增?如果删除
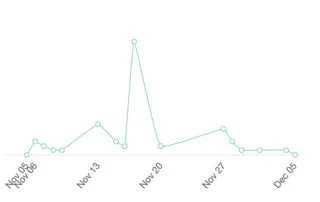
unit: week,并使用unitStepSize: 7手动设置步骤大小,则在开头做我想做的事情,但由于某种原因压缩了最后一个标签:
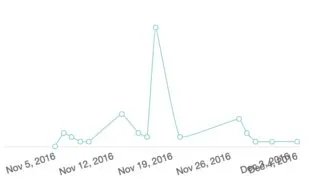
time对象中的min max。 max: scope.end_display, // 12/05/2016
min: scope.start_display // 11/05/2016
我得到:
为什么它不会在11/5开始线形图?
标签:
["11/05/2016", "11/06/2016", "11/07/2016", "11/08/2016", "11/09/2016", "11/13/2016", "11/15/2016", "11/16/2016", "11/17/2016", "11/20/2016", "11/27/2016", "11/28/2016", "11/29/2016", "12/01/2016", "12/04/2016"]
数据:
[0, 3, 2, 1, 1, 7, 3, 2, 26, 2, 6, 3, 1, 1, 1]