我正在使用Chart.js生成水平堆叠条形图。目前的图表如下所示: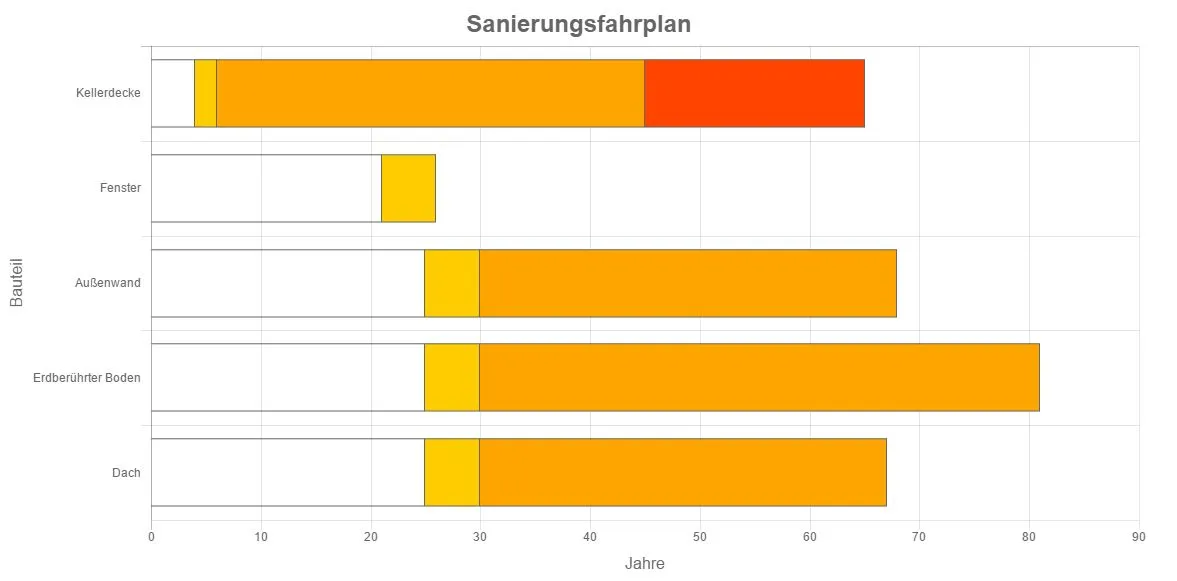 该图表显示用户在多少年后应对房屋的特定组件进行修复。我试图将其改为用户应在哪一年进行修复。将当前年份添加到数值中会导致以下结果:
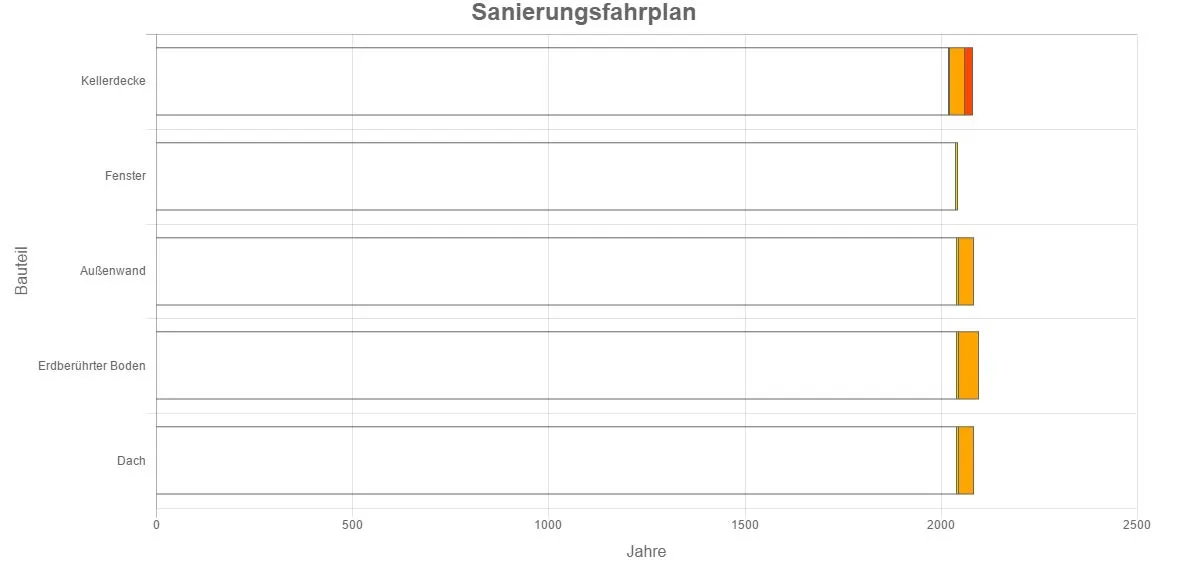 如果我可以将x轴的起始值设置为当前年份,那么这基本上就是我需要的了。我尝试这样设置最小值:
该图表显示用户在多少年后应对房屋的特定组件进行修复。我试图将其改为用户应在哪一年进行修复。将当前年份添加到数值中会导致以下结果:
如果我可以将x轴的起始值设置为当前年份,那么这基本上就是我需要的了。我尝试这样设置最小值:options: {
scales: {
xAxes: [{
ticks: {
min: 2017
},
...
很不幸,结果完全不显示数据集,像这样:
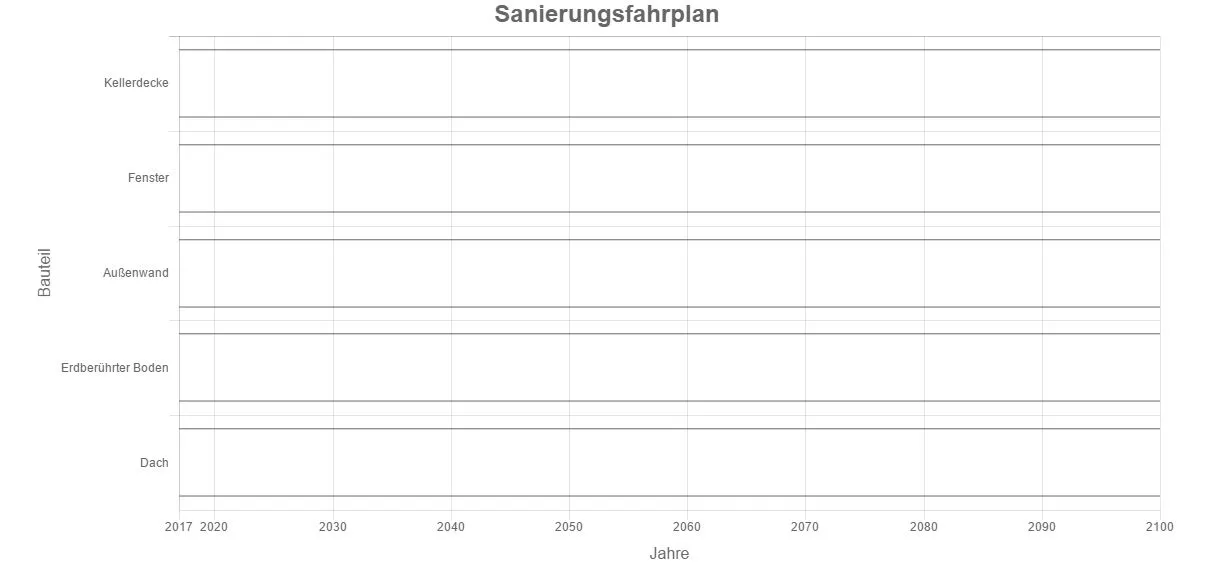
我尝试了所有添加当前年份和设置最小值的组合,但没有什么有用的图表。
以下是我的当前源代码:
var mainChart_ctx = document.getElementById("main_chart").getContext("2d");

var mainChart_config = {
  type: 'horizontalBar',
  data: {
    labels: ['Kellerdecke', 'Fenster', 'Außenwand', 'Erdberührter Boden', 'Dach'],
    datasets: [{
        label: 'Beginn ab heute',
        backgroundColor: 'transparent',
        data: [4, 21, 25, 25, 25],
        borderColor: '#666',
        borderWidth: 1
      },
      {
        label: 'Sanierungsdauer',
        backgroundColor: '#ffcc00',
        data: [2, 5, 5, 5, 5],
        borderColor: '#666',
        borderWidth: 1
      },
      {
        label: 'Mittlere Restlebensdauer',
        backgroundColor: 'orange',
        data: [39, 0, 38, 51, 37],
        borderColor: '#666',
        borderWidth: 1
      },
      {
        label: 'Maximale Restlebensdauer',
        backgroundColor: 'orangered',
        data: [20, 0, 0, 0, 0],
        borderColor: '#666',
        borderWidth: 1
      }
    ]
  },
  options: {
    tooltips: {
      enabled: true
    },
    legend: {
      display: false
    },
    title: {
      display: true,
      text: 'Sanierungsfahrplan',
      fontSize: 24
    },
    scales: {
      xAxes: [{
        ticks: {
          min: 0 /* Todo: change to current year? */
        },
        stacked: true,
        scaleLabel: {
          display: true,
          labelString: 'Jahre',
          fontSize: 16
        }
      }],
      yAxes: [{
        ticks: {
          stepSize: 10
        },
        stacked: false,
        scaleLabel: {
          display: true,
          labelString: 'Bauteil',
          fontSize: 16
        },
      }]
    }
  }
};

mainChart = new Chart(mainChart_ctx, mainChart_config)<script src="https://cdnjs.cloudflare.com/ajax/libs/Chart.js/2.5.0/Chart.bundle.min.js"></script>
<canvas id="main_chart"></canvas>
min值从0改为3,会出现一些丑陋的情况。这似乎是堆叠条形图的一个 bug。你可以在 https://github.com/chartjs/Chart.js/issues 上报告此问题。 - xnakos