添加第二个x轴会覆盖标题。

3

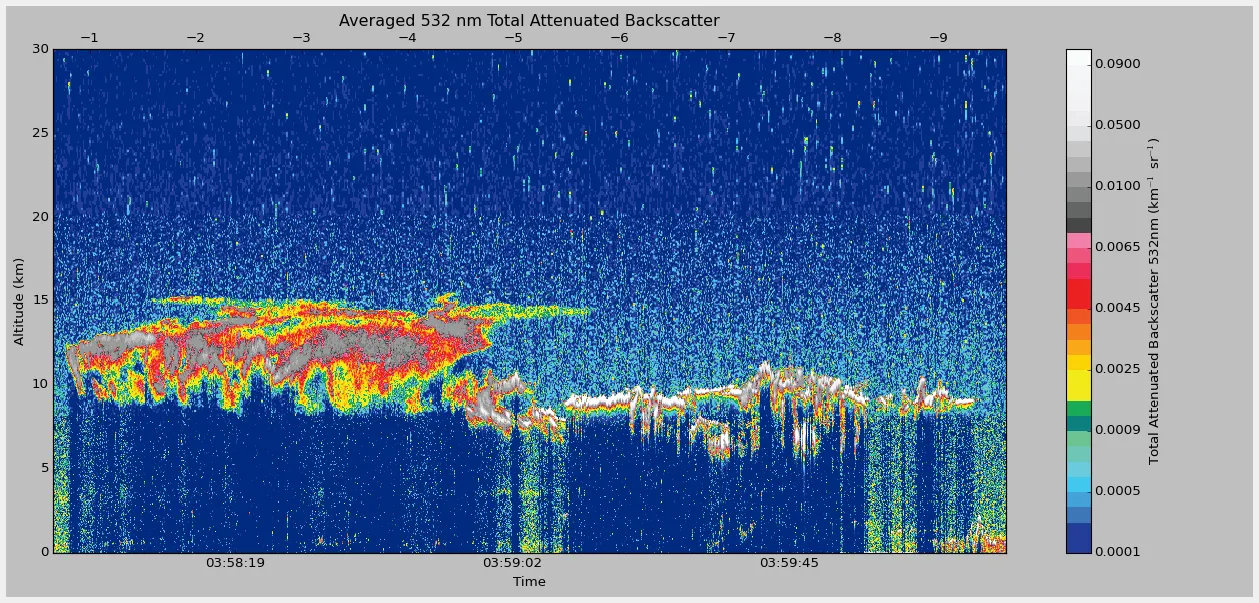
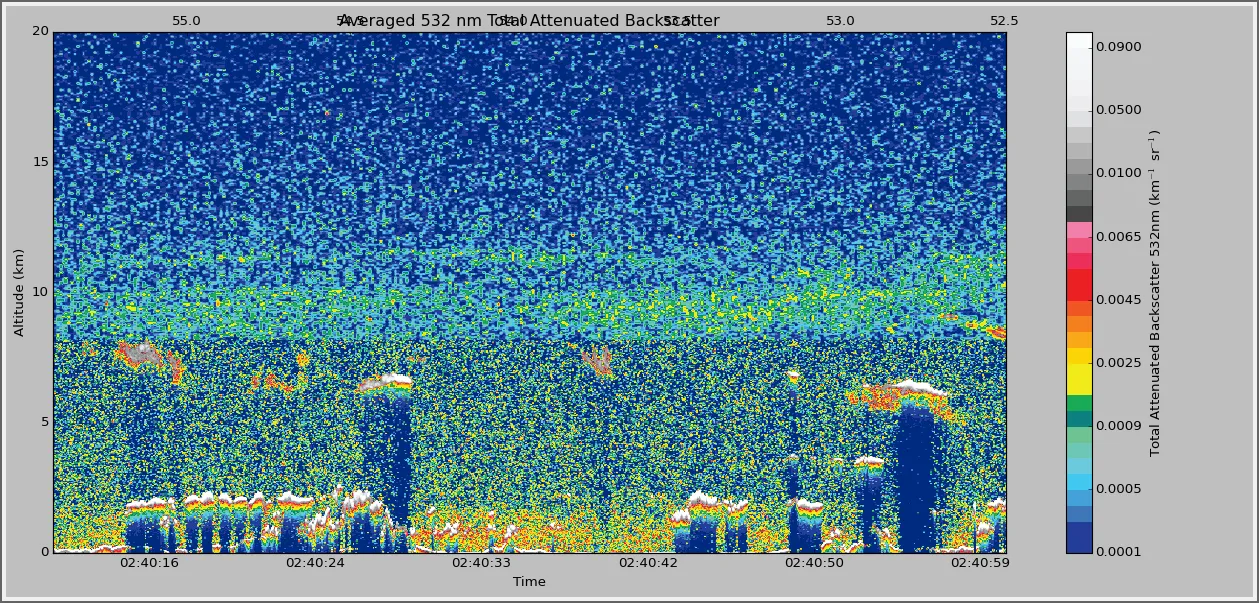
如何移动子图的标题,使得第二个轴不会在标题上方书写,而是在标题下方呢?以下是示例:

enter image description here

这是相关的代码片段:

    # fig is a subplotAxes object
    fig.set_ylabel('Altitude (km)')
    fig.set_xlabel('Time')   
    fig.get_xaxis().set_major_formatter(mpl.dates.DateFormatter('%H:%M:%S'))

    cbar_label = 'Total Attenuated Backscatter 532nm (km$^{-1}$ sr$^{-1}$)'
    cbar = pfig.colorbar(im)
    cbar.set_label(cbar_label)

    # create second axis
    ax2 = fig.twiny()
    ax2.set_label('Latitude')
    ax2.set_xlim(latitude[0], latitude[-1])

    # set title, but title is overwritten
    fig.set_title("Averaged 532 nm Total Attenuated Backscatter")

我不知道这是否会导致我的图形大小或者只是一个简单的格式错误。我不想扩大图形大小,因为这个图绘制在Tkinter窗口中。

酷炫的图表。它是关于什么的? - Beta Decay
2
@BetaDecay 我正在编写一些软件,用于跟踪地球大气中的有害气溶胶!网页链接 - Syntactic Fructose
3个回答

2

如果您的标题适用于整个图形而不仅仅是子图,@György Solymosi的答案可能是正确的选择(而不是添加新行,这有点像hack)。

或者,您可以将标题文本重新定位到任何您想要的位置,例如将其上移5%:

title = fig.set_title("Flying monkey density")
title_xy = title.get_position()
title.set_position([title_xy[0], title_xy[1]*1.05])

1

尝试使用fig.suptitle("平均532纳米总衰减反散射")


1
这个解决方案比我想象的要简单得多,我感觉很蠢。我所需要做的就是在标题末尾添加一个\n
 fig.set_title("Averaged 532 nm Total Attenuated Backscatter\n")

enter image description here


网页内容由stack overflow 提供, 点击上面的
可以查看英文原文,
原文链接