如何在matplotlib中在第一个x轴底部添加第二个x轴?

17
我指的是已经提出的问题,可以在 这里 查看。
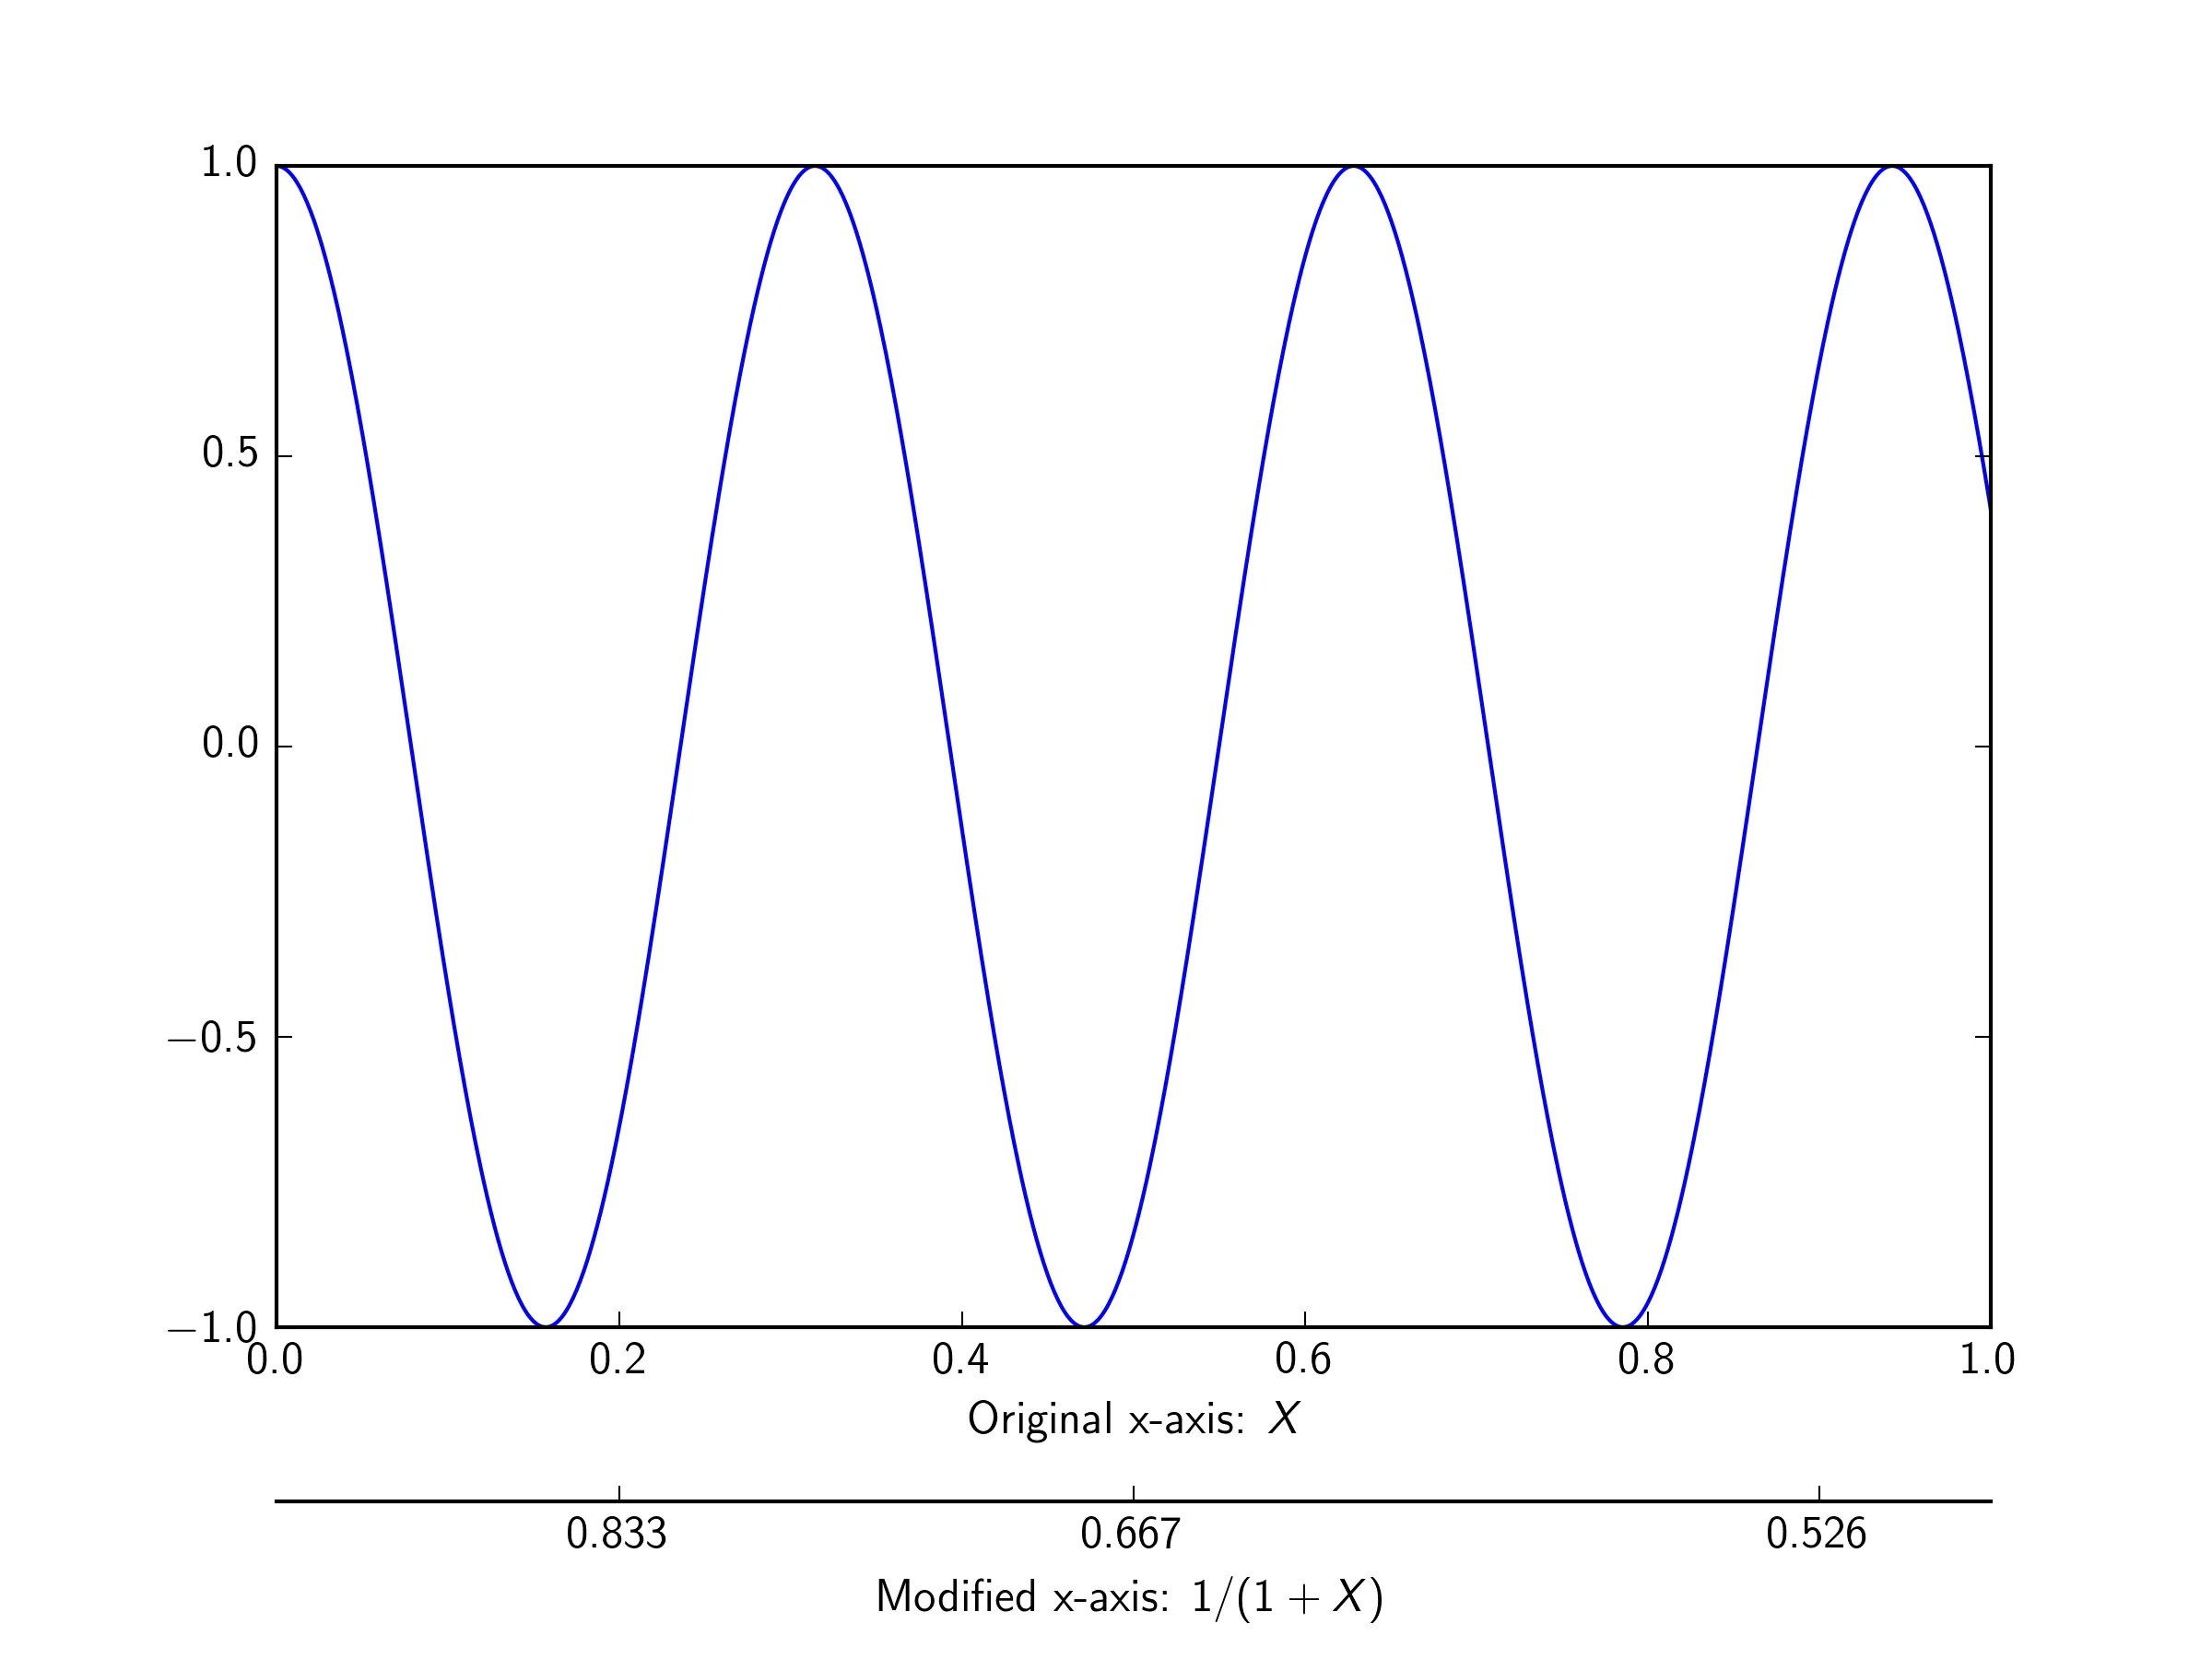
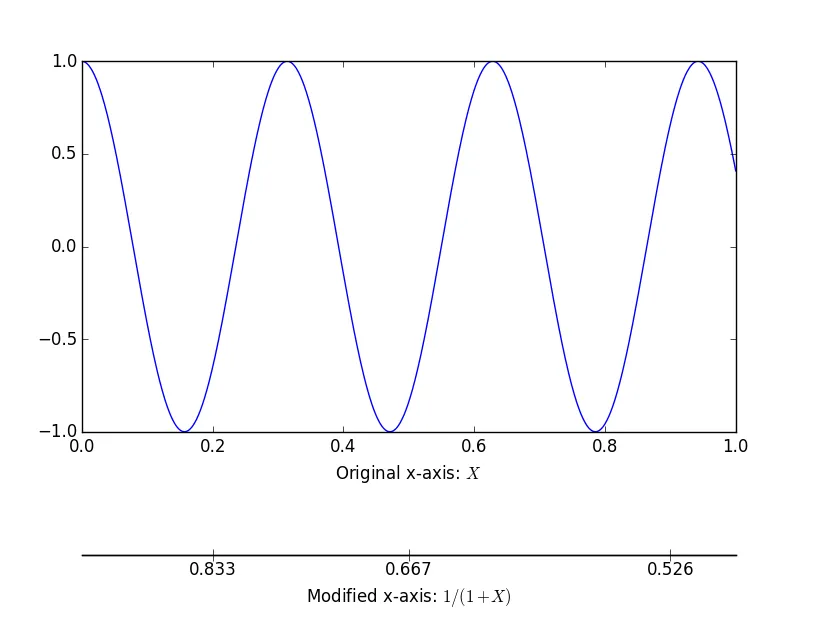
在这个例子中,用户通过将第二轴添加到图形的上部与标题重合来解决了第二轴的问题。
问题: 是否可以在第一个轴底部添加第二个 x 轴?
代码:
import numpy as np
import matplotlib.pyplot as plt

fig = plt.figure()
ax1 = fig.add_subplot(111)
ax2 = ax1.twiny()

X = np.linspace(0,1,1000)
Y = np.cos(X*20)

ax1.plot(X,Y)
ax1.set_xlabel(r"Original x-axis: $X$")

new_tick_locations = np.array([.2, .5, .9])

def tick_function(X):
    V = 1/(1+X)
    return ["%.3f" % z for z in V]

ax2.set_xticks(new_tick_locations)
ax2.set_xticklabels(tick_function(new_tick_locations))
ax2.set_xlabel(r"Modified x-axis: $1/(1+X)$")
plt.show()
3个回答

28

除了@DizietAsahi的答案之外,你可以像这里发布的matplotlib示例一样使用spines

import numpy as np
import matplotlib.pyplot as plt

fig = plt.figure()
ax1 = fig.add_subplot(111)
ax2 = ax1.twiny()

# Add some extra space for the second axis at the bottom
fig.subplots_adjust(bottom=0.2)

X = np.linspace(0,1,1000)
Y = np.cos(X*20)

ax1.plot(X,Y)
ax1.set_xlabel(r"Original x-axis: $X$")

new_tick_locations = np.array([.2, .5, .9])

def tick_function(X):
    V = 1/(1+X)
    return ["%.3f" % z for z in V]

# Move twinned axis ticks and label from top to bottom
ax2.xaxis.set_ticks_position("bottom")
ax2.xaxis.set_label_position("bottom")

# Offset the twin axis below the host
ax2.spines["bottom"].set_position(("axes", -0.15))

# Turn on the frame for the twin axis, but then hide all 
# but the bottom spine
ax2.set_frame_on(True)
ax2.patch.set_visible(False)

# as @ali14 pointed out, for python3, use this
# for sp in ax2.spines.values():
# and for python2, use this
for sp in ax2.spines.itervalues():
    sp.set_visible(False)
ax2.spines["bottom"].set_visible(True)

ax2.set_xticks(new_tick_locations)
ax2.set_xticklabels(tick_function(new_tick_locations))
ax2.set_xlabel(r"Modified x-axis: $1/(1+X)$")
plt.show()

这里输入图片描述


1
完全正常工作。对于Python 3.x,请使用for sp in ax2.spines.values(): - ali14
2
通常情况下,您必须手动为ax2设置xlim,以便与ax1相同: ax2.set_xlim(ax1.get_xlim()) - fanyul
@fanyul。准确的。我认为答案可以完成。 - Stef1611
@ttrndavison。请看Fanyul的评论。当我从ax1.get_xticks()获取new_ticks_location时,我遇到了正确对齐值的问题,而这个评论解决了我的问题。 - Stef1611

7
我认为你需要创建一个高度为0的第二个Axes(并隐藏yaxis),以便拥有第二个xaxis,可以将其放置在任何位置。
例如:
import numpy as np
import matplotlib.pyplot as plt

fig = plt.figure()
ax1 = fig.add_axes((0.1,0.3,0.8,0.6)) # create an Axes with some room below

X = np.linspace(0,1,1000)
Y = np.cos(X*20)

ax1.plot(X,Y)
ax1.set_xlabel(r"Original x-axis: $X$")


# create second Axes. Note the 0.0 height
ax2 = fig.add_axes((0.1,0.1,0.8,0.0))
ax2.yaxis.set_visible(False) # hide the yaxis

new_tick_locations = np.array([.2, .5, .9])

def tick_function(X):
    V = 1/(1+X)
    return ["%.3f" % z for z in V]

ax2.set_xticks(new_tick_locations)
ax2.set_xticklabels(tick_function(new_tick_locations))
ax2.set_xlabel(r"Modified x-axis: $1/(1+X)$")
plt.show()

enter image description here


0

这并不是对问题的真正回答,但我花了很长时间才弄清楚如何使用对数刻度来进行相同的操作。在这种情况下,有很多奇怪的行为。以下是我的代码,用于将一些简单的缩放应用于原始y轴:

def set_scaled_y_axis(ax, label1, label2, scale):
    #define the minor and major ticks
    #might give an error for too small or large exponents (e.g. 1e-20 or 1e+20)
    log_ticks_major=[]
    log_ticks_minor=[]
    tick_labels=[]
    for k in range(-15,16,1):
        log_ticks_major.append(10**k)
        tick_labels.append("10$^{"+f"{k}"+"}$")
        for kk in range(2,10):
            log_ticks_minor.append(kk*10**k)

    log_ticks_major=np.array(log_ticks_major)
    log_ticks_minor=np.array(log_ticks_minor)

    #update the original label
    ax.set_ylabel(label2)

    # make a twin axis and set the position
    # to make the same with x axis you need "ax.twiny()" instead
    ax22 = ax.twinx()
    ax22.yaxis.set_ticks_position("left")
    ax22.yaxis.set_label_position("left")
    ax22.spines["left"].set_position(("axes", -0.15))
    
    # draw only the left y axis
    ax22.xaxis.set_visible(False)

    # set the log scale for the 2nd axis
    ax22.set_yscale("log")
    ax22.set_yticks(log_ticks_minor/scale, minor=True) # set minor ticks
    ax22.set_yticks(log_ticks_major/scale) # set normal(/major?) ticks
    ax22.set_yticklabels(tick_labels) #must be after "ax22.set_yticks(log_ticks_major/scale)"
    ax22.tick_params('y', which="minor", labelleft=False) #some "random" minor tick labels would appear
    
    # set the 2nd y axis label
    ax22.set_ylabel(label1)

    # set the limits of the 2nd y axis to be the same as the 1st one
    ax22.set_ylim(ax.get_ylim())

网页内容由stack overflow 提供, 点击上面的
可以查看英文原文,
原文链接