单独绘制所有pandas数据框列的图表

24

我有一个仅包含数字列的pandas数据框,我试图为所有特征创建单独的直方图

ind group people value value_50
 1      1    5    100    1
 1      2    2    90     1
 2      1    10   80     1
 2      2    20   40     0
 3      1    7    10     0
 3      2    23   30     0

但是在我的实际数据中有50多个列,我该如何为它们创建单独的图表

我已经尝试过

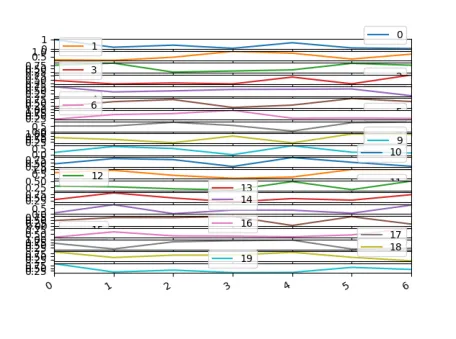
df.plot.hist( subplots = True, grid = True)

它给了我一个重叠不清晰的情节。

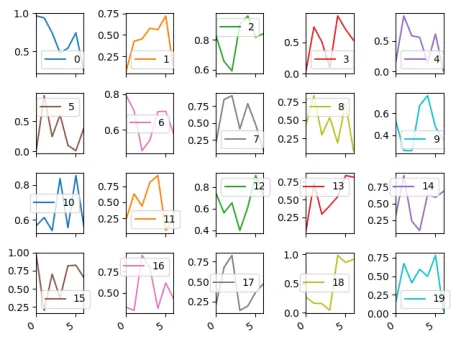
我该如何使用 pandas 的 subplots=True 功能来排列它们。下面的例子可以帮助我在一个 2x2 的网格中获取四列图表,但这对于全部 50 列来说是一个冗长的方法。

fig, [(ax1,ax2),(ax3,ax4)]  = plt.subplots(2,2, figsize = (20,10))

你想在4个子图中绘制50个以上的直方图吗? - Stop harming Monica
你使用了紧凑布局吗? - RockAndRoleCoder
@goyo 不是4个子图,那只是一个例子。 - Manu Sharma
那么这是一个你不想要的例子。但是你想要什么呢?这个图形应该长什么样? - Stop harming Monica
@goyo 为数据框中的所有列绘制直方图,非常简单!在上面的示例中,有5列,在我的实际示例中有50列。你能写点通用的东西吗?我相信这是可以做到的。 - Manu Sharma
看起来你只需要一个更大的数字,但你已经知道如何做到这一点,那么缺少什么呢? - Stop harming Monica
5个回答

70

Pandas subplots=True 会将轴排列在单列中。

import numpy as np
import matplotlib.pyplot as plt
import pandas as pd

df = pd.DataFrame(np.random.rand(7,20))

df.plot(subplots=True)

plt.tight_layout()
plt.show()

输入图像描述

这里没有应用tight_layout,因为图形太小了,无法使轴正确排列。不过可以使用更大的图形(figsize=(...))。

为了将轴放在网格上,可以使用layout参数,例如:

df.plot(subplots=True, layout=(4,5))

enter image description here

如果使用 plt.subplots() 创建轴也可以实现同样的效果。

fig, axes = plt.subplots(nrows=4, ncols=5)
df.plot(subplots=True, ax=axes)

@ImportanceOfBeingErnest,你能想出如何在每个图中处理X和Y轴比例尺吗?!这是问题的链接 - Girish Kumar Chandora

14

如果你想将它们分开绘制(这也是我来到这里的原因),可以使用

for i in df.columns:
    plt.figure()
    plt.hist(df[i])

10
此任务的替代方法可以使用带有超参数“layout”的“hist”方法。以下是使用@ImportanceOfBeingErnest提供的部分代码的示例:
import numpy as np
import matplotlib.pyplot as plt
import pandas  as pd

df = pd.DataFrame(np.random.rand(7,20))

df.hist(layout=(5,4), figsize=(15,10))

plt.show()

3

使用pandas.DataFrame,我建议使用pandas.DataFrame.apply。通过使用自定义函数进行操作,在这个例子中是plot(),你可以打印并单独保存每个图片。

def plot(col):
 
    fig, ax = plt.subplots()
    ax.plot(col)
    plt.show()

df.apply(plot)

0

虽然这个问题没有要求,但我想补充一下,使用 x 参数绘制图表可以让您指定 x 轴数据的列。

import numpy as np
import matplotlib.pyplot as plt
import pandas as pd

df = pd.DataFrame(np.random.rand(7,20),columns=list('abcdefghijklmnopqrst'))
df.plot(x='a',subplots=True, layout=(4,5))    

plt.tight_layout()
plt.show()

https://pandas.pydata.org/docs/reference/api/pandas.DataFrame.plot.html


网页内容由stack overflow 提供, 点击上面的
可以查看英文原文,
原文链接