我有一个包含三列(year, action, comedy)的数据框 total_year。
如何在 y 轴上绘制两列数据 (action 和 comedy)?我的代码只绘制了一列:
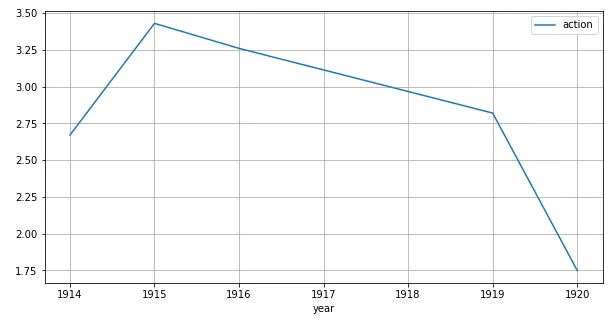
total_year[-15:].plot(x='year', y='action', figsize=(10,5), grid=True)
我有一个包含三列(year, action, comedy)的数据框 total_year。
如何在 y 轴上绘制两列数据 (action 和 comedy)?我的代码只绘制了一列:
total_year[-15:].plot(x='year', y='action', figsize=(10,5), grid=True)
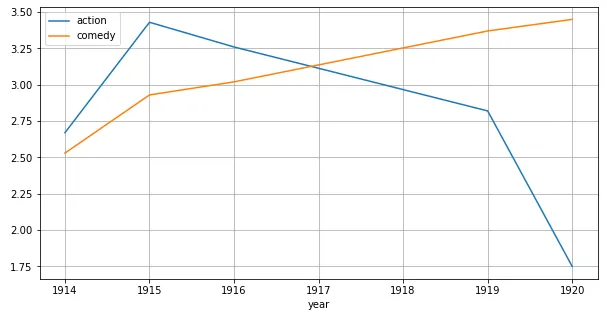
在pandas绘图函数的y参数中可以提供多个列名,这些列名应该以列表形式指定,如下所示。
df.plot(x="year", y=["action", "comedy"])
完整示例:
import matplotlib.pyplot as plt
import pandas as pd

df = pd.DataFrame({"year": [1914,1915,1916,1919,1920],
                   "action" : [2.6,3.4,3.25,2.8,1.75],
                   "comedy" : [2.5,2.9,3.0,3.3,3.4] })
df.plot(x="year", y=["action", "comedy"])
plt.show()

Pandas.DataFrame.plot()默认使用索引作为X轴进行绘图,所有其他数值型列将用作Y值。
因此,将year列设置为索引即可解决问题:
total_year.set_index('year').plot(figsize=(10,5), grid=True)
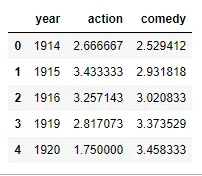
pandas.DataFrame.plot时,只需将一个列指定为x参数即可。numeric值的列将用于y。'date'保留为string类型。但是,如果将'date'转换为datetime dtype,则绘图API还将在y轴上绘制'date'列。y参数;但是,如果数据框仅包含要绘制的列,则仅需指定x参数。x=。import pandas as pd
# test data
data = {'year': [1914, 1915, 1916, 1919, 1920],
'action': [2.67, 3.43, 3.26, 2.82, 1.75],
'comedy': [2.53, 2.93, 3.02, 3.37, 3.45],
'test1': ['a', 'b', 'c', 'd', 'e'],
'date': ['1914-01-01', '1915-01-01', '1916-01-01', '1919-01-01', '1920-01-01']}
# create the dataframe
df = pd.DataFrame(data)
# display(df)
year action comedy test1 date
0 1914 2.67 2.53 a 1914-01-01
1 1915 3.43 2.93 b 1915-01-01
2 1916 3.26 3.02 c 1916-01-01
3 1919 2.82 3.37 d 1919-01-01
4 1920 1.75 3.45 e 1920-01-01
# plot the dataframe
df.plot(x='year', figsize=(10, 5), grid=True)