泊松过程的测试

6
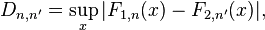
我想对假设空无偏差的泊松过程下事件发生时间进行一些测试(详见例如http://en.wikipedia.org/wiki/Poisson_process)。针对固定事件次数,相应范围内的时间看起来像是一个均匀分布的排序版本。在http://docs.scipy.org/doc/scipy-0.7.x/reference/generated/scipy.stats.kstest.html中已经实现了Kolmogorov-Smirnov测试,但我无法看出如何在scipy.stats中使用它,因为它似乎不知道泊松过程。

作为一个简单的样例,这个样本数据应该给出任何这种测试的高p值。

import random
nopoints = 100
max = 1000

points = sorted([random.randint(0,max) for j in xrange(nopoints)])

如何为此问题制定一个明智的测试?

从www.stat.wmich.edu/wang/667/classnotes/pp/pp.pdf‎中我看到:

"注6.3(测试泊松分布)上述定理也可用于检验给定计数过程是否为泊松过程。这可以通过观察在固定时间t内的过程来完成。如果在此时间段内我们观察到n次事件,并且该过程是泊松的,则无序发生时间将独立且均匀地分布在(0,t]上。因此,我们可以通过测试n个发生时间是否来自均匀(0,t]总体来测试该过程是否为泊松过程。这可以通过标准统计程序(例如Kolmogorov-Smirov测试)来完成。"


scipy.stats 知道泊松分布: `>>> import scipy.stats as stats
stats.poisson.pmf(1, mu=3) 0.14936120510359185`
- ev-br
使用 Kolmogorov-Smirnov 测试的问题在于,测试统计量的分布对于离散和连续分布并不相同,而且如果你估计参数也是如此。kstest 的 p 值假定它是一个没有估计参数的连续分布,如果在你的问题中不是这种情况,那么 p 值将不正确。(这也适用于 Hooked 的答案) - Josef
如果您拥有注释6.3的连续时间,则仍然可以使用kstest并以均匀分布作为空假设分布。如果您有离散事件或事件时间,则可以使用卡方分布。在statsmodels邮件列表上刚刚有相同的问题,涉及到泊松过程同质性的其他测试(例如将其分成时间间隔进行分组),但我没有任何可供使用的测试。 - Josef
3个回答

4

警告:此文写作较快,某些细节未经验证

指数分布的适当估计方法,卡方检验自由度是多少

基于讲座笔记

使用scipy.stats库中的kstest和卡方检验展示了同质性不被三种测试拒绝的影响。

# -*- coding: utf-8 -*-
"""Tests for homogeneity of Poissson Process

Created on Tue Sep 17 13:50:25 2013

Author: Josef Perktold
"""

import numpy as np
from scipy import stats

# create an example dataset
nobs = 100
times_ia = stats.expon.rvs(size=nobs) # inter-arrival times
times_a = np.cumsum(times_ia) # arrival times
t_total = times_a.max()

# not used
#times_as = np.sorted(times_a)
#times_ia = np.diff(times_as)

bin_limits = np.array([ 0. ,  0.5,  1. ,  1.5,  2. ,  np.inf])
nfreq_ia, bins_ia = np.histogram(times_ia, bin_limits)


# implication: arrival times are uniform for fixed interval
# using times.max() means we don't really have a fixed interval
print stats.kstest(times_a, stats.uniform(0, t_total).cdf)

# implication: inter-arrival times are exponential
lambd = nobs * 1. / t_total
scale = 1. / lambd

expected_ia = np.diff(stats.expon.cdf(bin_limits, scale=scale)) * nobs
print stats.chisquare(nfreq_ia, expected_ia, ddof=1)

# implication: given total number of events, distribution of times is uniform
# binned version
n_mean_bin = 10
n_bins_a = nobs // 10
bin_limits_a = np.linspace(0, t_total+1e-7, n_bins_a + 1)
nfreq_a, bin_limits_a = np.histogram(times_a, bin_limits_a)
# expect uniform distributed over every subinterval
expected_a = np.ones(n_bins_a) / n_bins_a * nobs
print stats.chisquare(nfreq_a, expected_a, ddof=1)

2

在确定两个分布是否不同时,KS检验只是它们之间的最大差异:

enter image description here

这很容易自己计算。下面的程序计算了具有不同参数集的两个泊松过程的KS统计量:

import numpy as np

N = 10**6
X  = np.random.poisson(10, size=N)
X2 = np.random.poisson(7, size=N)

bins = np.arange(0, 30,1)
H1,_ = np.histogram(X , bins=bins, normed=True)
H2,_ = np.histogram(X2, bins=bins, normed=True)

D = np.abs(H1-H2)

idx = np.argmax(D)
KS = D[idx]

# Plot the results
import pylab as plt
plt.plot(H1, lw=2,label="$F_1$")
plt.plot(H2, lw=2,label="$F_2$")
text = r"KS statistic, $\sup_x |F_1(x) - F_2(x)| = {KS:.4f}$"
plt.plot(D, '--k', label=text.format(KS=KS),alpha=.8)
plt.scatter([bins[idx],],[D[idx],],s=200,lw=0,alpha=.8,color='k')
plt.axis('tight')
plt.legend()

enter image description here


@Anush KS检验假设您有一个要与之比较的分布。听起来您已经有了一个模型 - 泊松分布。在这种情况下,您将把F1更改为上面的数据。当查看分布时,我不确定您所说的“排序”是什么意思,通常我认为CDF是由平均值得出的。排序应该是无关紧要的,事实上,泊松过程假定idd,这是更强的假设。 - Hooked
@Anush 要从一系列“观察”(指指数分布的时间)得出一个“分布”,你可以将这些观察结果放入不同区间的柱状图中(如示例所示),并进行归一化处理,即可得出分布。 - Hooked
谢谢。我认为我的困惑只在于如何选择箱子的大小,或者是否真的需要分箱。 - Simd

0
问题是,正如您提供的文档所建议的那样:“KS检验仅适用于连续分布。”而泊松分布是离散的。

我建议您可以使用此链接中的示例: {{link1:http://nbviewer.ipython.org/urls/raw.github.com/CamDavidsonPilon/Probabilistic-Programming-and-Bayesian-Methods-for-Hackers/master/Chapter1_Introduction/Chapter1_Introduction.ipynb}} (查找“##### Example: Inferring behaviour from text-message data”)

在该链接中,他们检查了一个特定数据集的适当λ值,其中他们假设其根据泊松过程进行分布。


网页内容由stack overflow 提供, 点击上面的
可以查看英文原文,
原文链接