适配泊松直方图

29

我试图在这个泊松分布的直方图上拟合一个曲线,它看起来像这样histo

我已经修改了拟合函数,使其类似于泊松分布,其中参数t作为变量。但是curve_fit函数无法绘制出来,我不确定原因。

def histo(bsize):
    N = bsize
    #binwidth
    bw = (dt.max()-dt.min())/(N-1.)
    bin1 = dt.min()+ bw*np.arange(N)
    #define the array to hold the occurrence count
    bincount= np.array([])
    for bin in bin1:
        count = np.where((dt>=bin)&(dt<bin+bw))[0].size
        bincount = np.append(bincount,count)
    #bin center
    binc = bin1+0.5*bw
    plt.figure()
    plt.plot(binc,bincount,drawstyle= 'steps-mid')
    plt.xlabel("Interval[ticks]")
    plt.ylabel("Frequency")
histo(30)
plt.xlim(0,.5e8)
plt.ylim(0,25000)
import numpy as np
from scipy.optimize import curve_fit
delta_t = 1.42e7
def func(x, t):
    return t * np.exp(- delta_t/t) 
popt, pcov = curve_fit(func, np.arange(0,.5e8),histo(30))
plt.plot(popt)

你能提供一下回溯吗?我强烈怀疑你不理解 curve_fit 返回的是什么。请参阅 http://docs.scipy.org/doc/scipy-0.14.0/reference/generated/scipy.optimize.curve_fit.html - tacaswell
1
两件事情:1)你不需要编写自己的直方图函数,只需使用np.histogram;2)如果你有实际数据,请勿将曲线拟合到直方图上,而是使用scipy.stats对数据本身进行拟合。 - askewchan
你所实现的 func 不是泊松分布。 - MaxNoe
2个回答

72

你的代码问题在于你不知道 curve_fit 的返回值是什么,它是拟合函数的参数及其协方差矩阵,而不是可以直接绘制的内容。

分段最小二乘拟合

一般来说,你可以更容易地获得所有东西:

import numpy as np
import matplotlib.pyplot as plt
from scipy.optimize import curve_fit
from scipy.special import factorial
from scipy.stats import poisson

# get poisson deviated random numbers
data = np.random.poisson(2, 1000)

# the bins should be of integer width, because poisson is an integer distribution
bins = np.arange(11) - 0.5
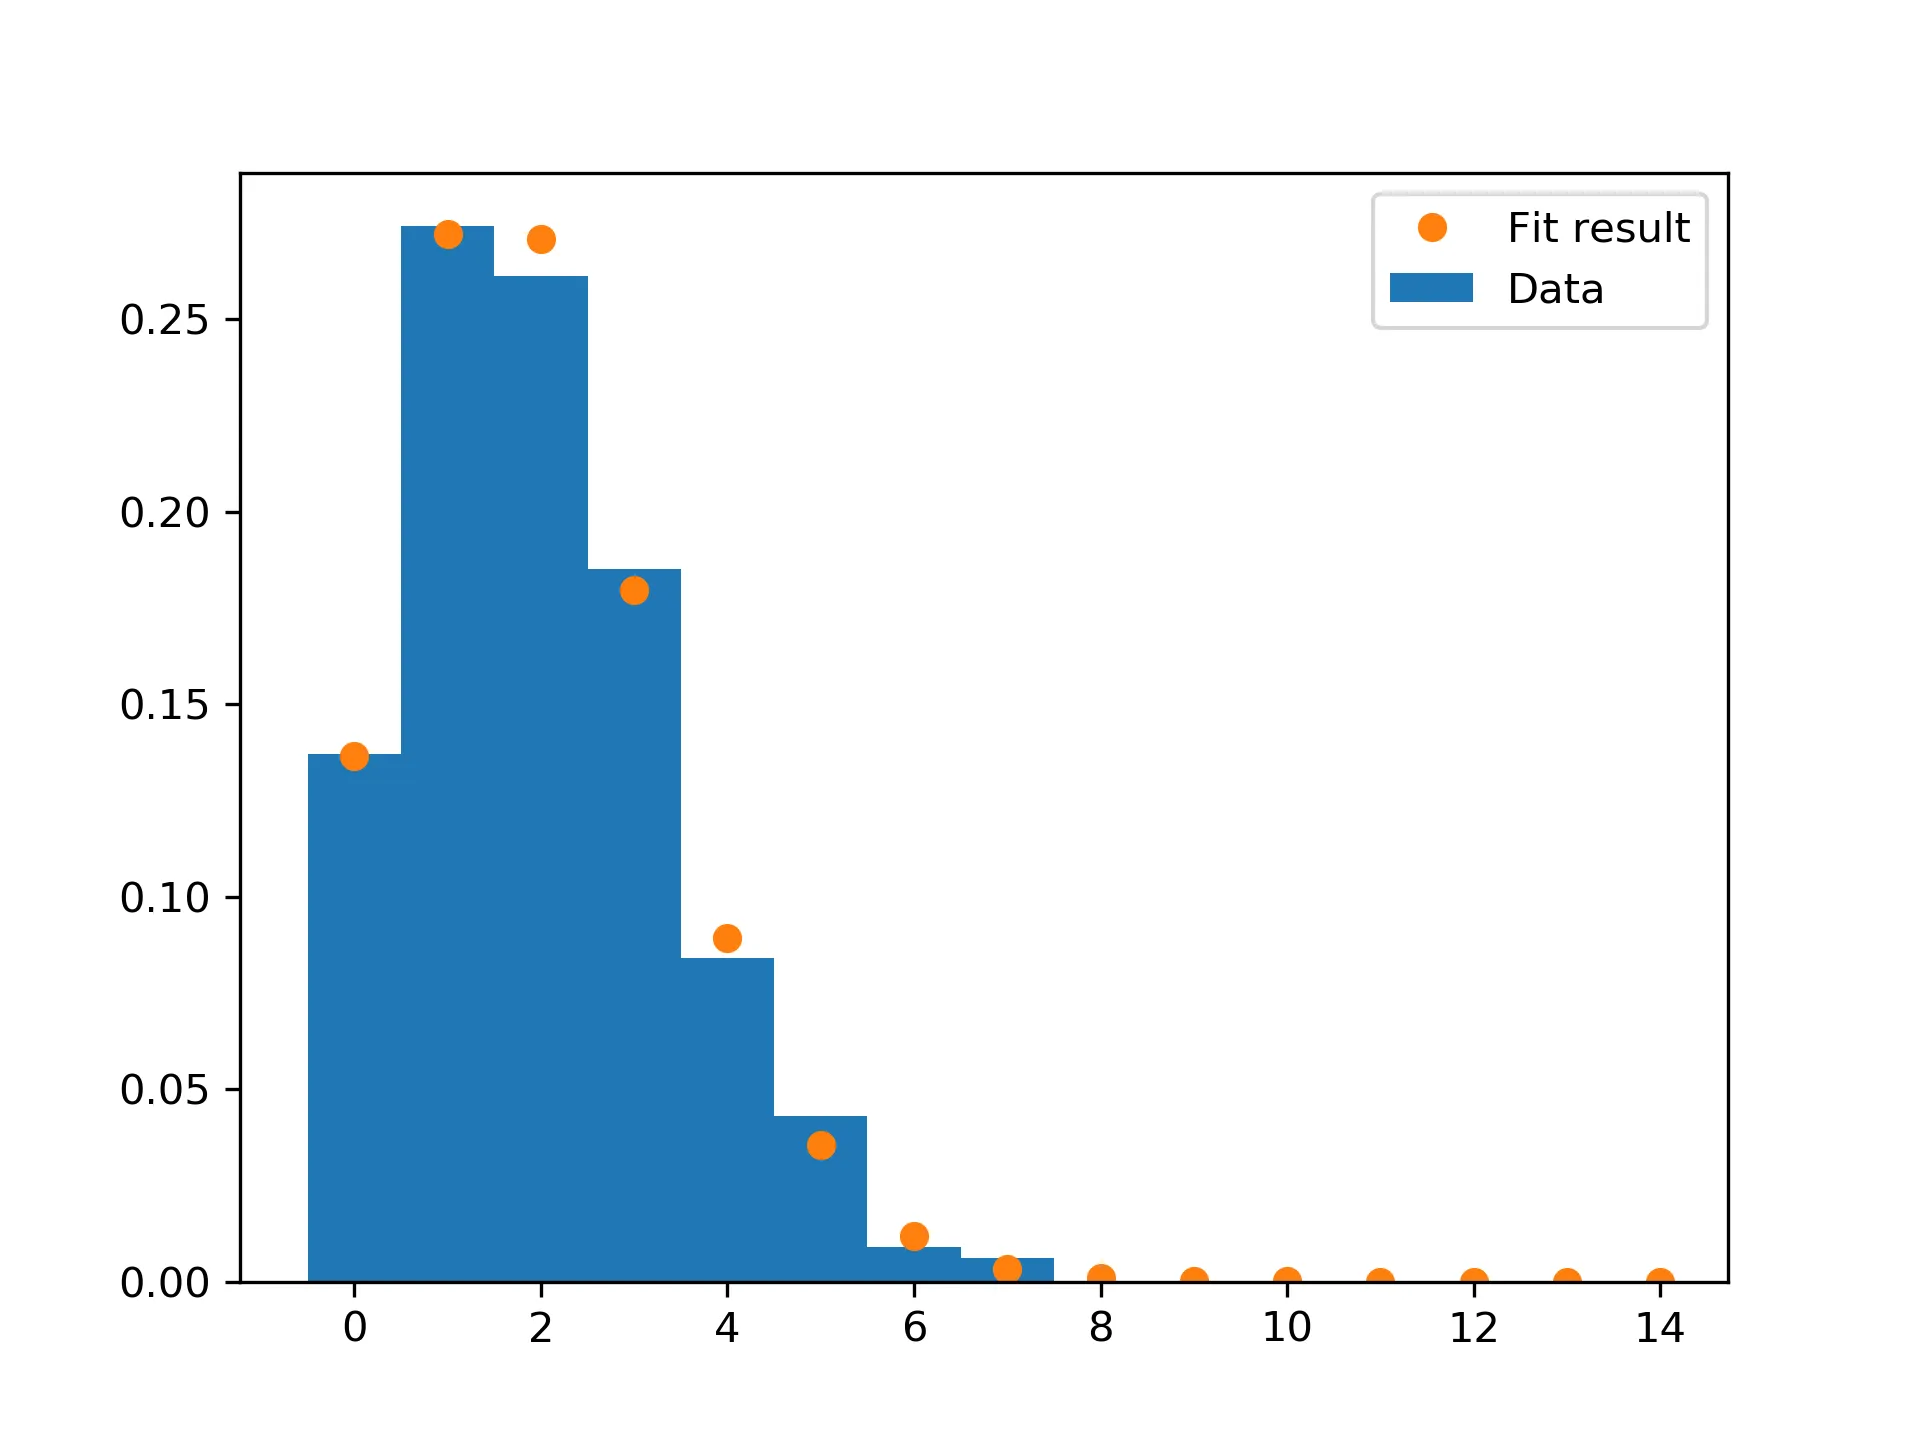
entries, bin_edges, patches = plt.hist(data, bins=bins, density=True, label='Data')

# calculate bin centers
bin_centers = 0.5 * (bin_edges[1:] + bin_edges[:-1])


def fit_function(k, lamb):
    '''poisson function, parameter lamb is the fit parameter'''
    return poisson.pmf(k, lamb)


# fit with curve_fit
parameters, cov_matrix = curve_fit(fit_function, bin_centers, entries)

# plot poisson-deviation with fitted parameter
x_plot = np.arange(0, 15)

plt.plot(
    x_plot,
    fit_function(x_plot, *parameters),
    marker='o', linestyle='',
    label='Fit result',
)
plt.legend()
plt.show()

这是结果: binned fit

最大似然去边界拟合

更好的选择是不使用直方图,而是进行最大似然拟合。

但是经过更仔细的观察,甚至这也是不必要的,因为泊松分布参数的最大似然估计量是算术平均值。

但是,如果您有其他更复杂的概率密度函数,可以将其用作示例:

import numpy as np
import matplotlib.pyplot as plt
from scipy.optimize import minimize
from scipy.special import factorial
from scipy import stats


def poisson(k, lamb):
    """poisson pdf, parameter lamb is the fit parameter"""
    return (lamb**k/factorial(k)) * np.exp(-lamb)


def negative_log_likelihood(params, data):
    """
    The negative log-Likelihood-Function
    """

    lnl = - np.sum(np.log(poisson(data, params[0])))
    return lnl

def negative_log_likelihood(params, data):
    ''' better alternative using scipy '''
    return -stats.poisson.logpmf(data, params[0]).sum()


# get poisson deviated random numbers
data = np.random.poisson(2, 1000)

# minimize the negative log-Likelihood

result = minimize(negative_log_likelihood,  # function to minimize
                  x0=np.ones(1),            # start value
                  args=(data,),             # additional arguments for function
                  method='Powell',          # minimization method, see docs
                  )
# result is a scipy optimize result object, the fit parameters 
# are stored in result.x
print(result)

# plot poisson-distribution with fitted parameter
x_plot = np.arange(0, 15)

plt.plot(
    x_plot,
    stats.poisson.pmf(x_plot, result.x),
    marker='o', linestyle='',
    label='Fit result',
)
plt.legend()
plt.show()

4
对于将曲线拟合到数据点而言,该方法非常好,并且在编程意义上回答了问题。然而,如果你正在对泊松分布的数据进行拟合,在科学/统计学意义上,最好是将其拟合到样本本身,而不是直方图! - askewchan
当然,我会将这个添加到我的回答中。 - MaxNoe
12
我添加了一个未分组的似然拟合。 - MaxNoe
如何确保我的直方图箱的宽度是整数值? - user6039682
可能值得补充的是,对于lambda参数的最大似然估计,就是样本均值。既然这是一个已知结果,我们实际上不需要任何其他信息。 - Astrid
显示剩余3条评论

0

感谢您的精彩讨论!

您可能想考虑以下几点:

1)为了获得更好的数值行为,不要计算“泊松分布”,而是计算“对数泊松分布”。

2)不要使用“lamb”,而是使用对数(我称之为“log_mu”),以避免拟合“漫游”到“mu”的负值。因此,

log_poisson(k, log_mu): return k*log_mu - loggamma(k+1) - math.exp(log_mu)

其中 "loggamma" 是 scipy.special.loggamma 函数。

实际上,在上述拟合中,“loggamma”项仅为被最小化的函数添加一个常量偏移量,因此可以执行以下操作:

log_poisson_(k, log_mu): return k*log_mu - math.exp(log_mu)

注意:log_poisson_()log_poisson()不同,但在上面的最小化使用中,将给出相同的拟合最小值(相同的mu值,直到数值问题)。被最小化的函数值已经被抵消,但人们通常也不关心这一点。

网页内容由stack overflow 提供, 点击上面的
可以查看英文原文,
原文链接