提前警告,对于这样的大树,可能大多数解决方案运行速度都会有些慢。但是这里有一种解决方案(使用 dendextend R包):
m<-matrix(1:1600,nrow=40)
m_dist<-as.dist(m,diag = FALSE )
m_hclust<-hclust(m_dist, method= "complete")
plot(m_hclust)
groups <- cutree(m_hclust, k=18)
install.packages.2 <- function (pkg) if (!require(pkg)) install.packages(pkg);
install.packages.2('dendextend')
install.packages.2('colorspace')
library(dendextend)
library(colorspace)
k <- 4
cols <- rainbow_hcl(k)
dend <- as.dendrogram(m_hclust)
dend <- color_branches(dend, k = k)
plot(dend)
labels_dend <- labels(dend)
groups <- cutree(dend, k=4, order_clusters_as_data = FALSE)
dends <- list()
for(i in 1:k) {
labels_to_keep <- labels_dend[i != groups]
dends[[i]] <- prune(dend, labels_to_keep)
}
par(mfrow = c(2,2))
for(i in 1:k) {
plot(dends[[i]],
main = paste0("Tree number ", i))
}

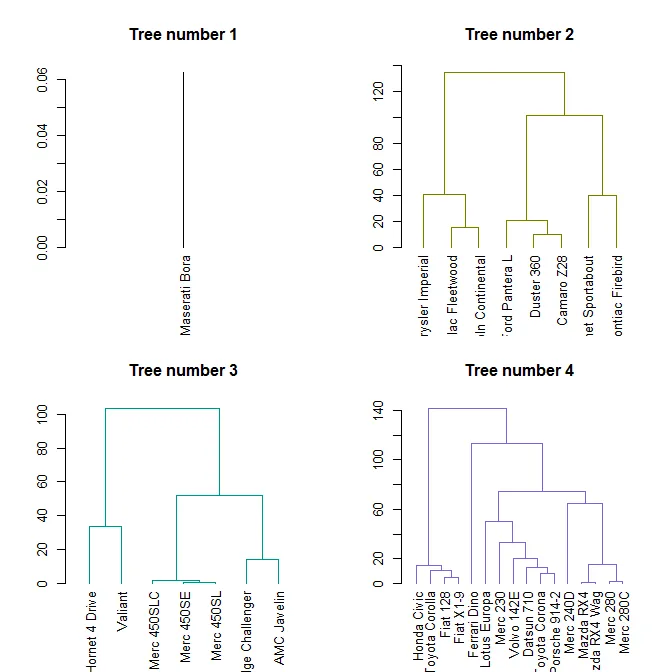
让我们在一棵“更好”的树上再做一次:
m_dist<-dist(mtcars,diag = FALSE )
m_hclust<-hclust(m_dist, method= "complete")
plot(m_hclust)
install.packages.2 <- function (pkg) if (!require(pkg)) install.packages(pkg);
install.packages.2('dendextend')
install.packages.2('colorspace')
library(dendextend)
library(colorspace)
k <- 4
cols <- rainbow_hcl(k)
dend <- as.dendrogram(m_hclust)
dend <- color_branches(dend, k = k)
plot(dend)
labels_dend <- labels(dend)
groups <- cutree(dend, k=4, order_clusters_as_data = FALSE)
dends <- list()
for(i in 1:k) {
labels_to_keep <- labels_dend[i != groups]
dends[[i]] <- prune(dend, labels_to_keep)
}
par(mfrow = c(2,2))
for(i in 1:k) {
plot(dends[[i]],
main = paste0("Tree number ", i))
}