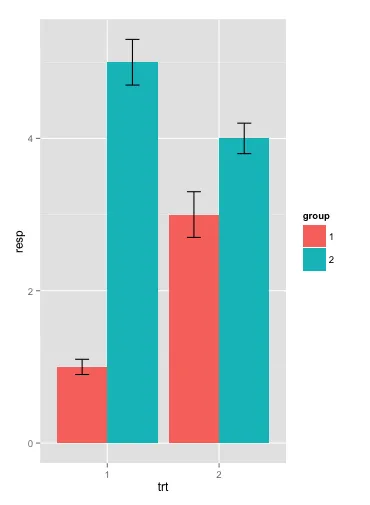
现在使用一般情况下实现这个功能相当容易(其中不能将较低的误差棒隐藏在其他绘图元素下),因为他们使得使用自定义geom扩展ggplot2非常容易。
从ggplot2的github仓库中复制geom_errorbar的代码到新的.R文件中,然后进行以下几个修改:
geom_uperrorbar <- function(mapping = NULL, data = NULL,
   stat = "identity", position = "identity",
   ...,
   na.rm = FALSE,
   show.legend = NA,
   inherit.aes = TRUE) {
   layer(
      data = data,
      mapping = mapping,
      stat = stat,
      geom = GeomUperrorbar,
      position = position,
      show.legend = show.legend,
      inherit.aes = inherit.aes,
      params = list(
         na.rm = na.rm,
         ...
      )
   )
}
上述唯一需要更改的两个地方是将geom_errorbar更改为geom_uperrorbar,并将geom = GeomErrorbar更改为geom = GeomUperrorbar。
GeomUperrorbar <- ggproto("GeomUperrorbar", Geom,
   default_aes = aes(colour = "black", size = 0.5, linetype = 1, width = 0.5,
      alpha = NA),

   draw_key = draw_key_path,
请注意,此注释中断了部分代码块,下面的代码块将继续执行函数。在上面,我们只是将
GeomErrorbar 两次更改为
GeomUperrorbar。
   required_aes = c("x", "y", "ymax"),

   setup_data = function(data, params) {
      data$width <- data$width %||%
         params$width %||% (resolution(data$x, FALSE) * 0.9)

      transform(data,
         xmin = x - width / 2, xmax = x + width / 2, width = NULL
      )
   },
再次中断函数。以上我们将所需的美学要求更改为x,y和ymax,即用y替换ymin。我们需要y从那里开始竖线(而不是在ymin处),因此我们不再需要ymin,因为那里不会有水平线。
   draw_panel = function(data, panel_scales, coord, width = NULL) {
      GeomPath$draw_panel(data.frame(
         x = as.vector(rbind(data$xmin, data$xmax, NA, data$x,   data$x)),
         y = as.vector(rbind(data$ymax, data$ymax, NA, data$ymax, data$y)),
         colour = rep(data$colour, each = 5),
         alpha = rep(data$alpha, each = 5),
         size = rep(data$size, each = 5),
         linetype = rep(data$linetype, each = 5),
         group = rep(1:(nrow(data)), each = 5),
         stringsAsFactors = FALSE,
         row.names = 1:(nrow(data) * 5)
      ), panel_scales, coord)
   }
)
我们在传递给 x 和 y 的向量中删除了最后三个元素,这些元素是用于下限误差线的。此外,我们将最后一个元素从 ymin 更改为 y,因为我们希望该线从 y 开始,而不是从 ymin 开始。
"%||%" <- function(a, b) {
   if (!is.null(a)) a else b
}
这最后一部分只是在代码中需要定义的一个方便函数。
如果您包含所有这些代码源文件,那么您可以像使用
geom_errorbar一样使用
geom_uperrorbar,甚至可以将
geom = "uperrorbar"传递给
stat_summary, 使用
y而不是
ymin。