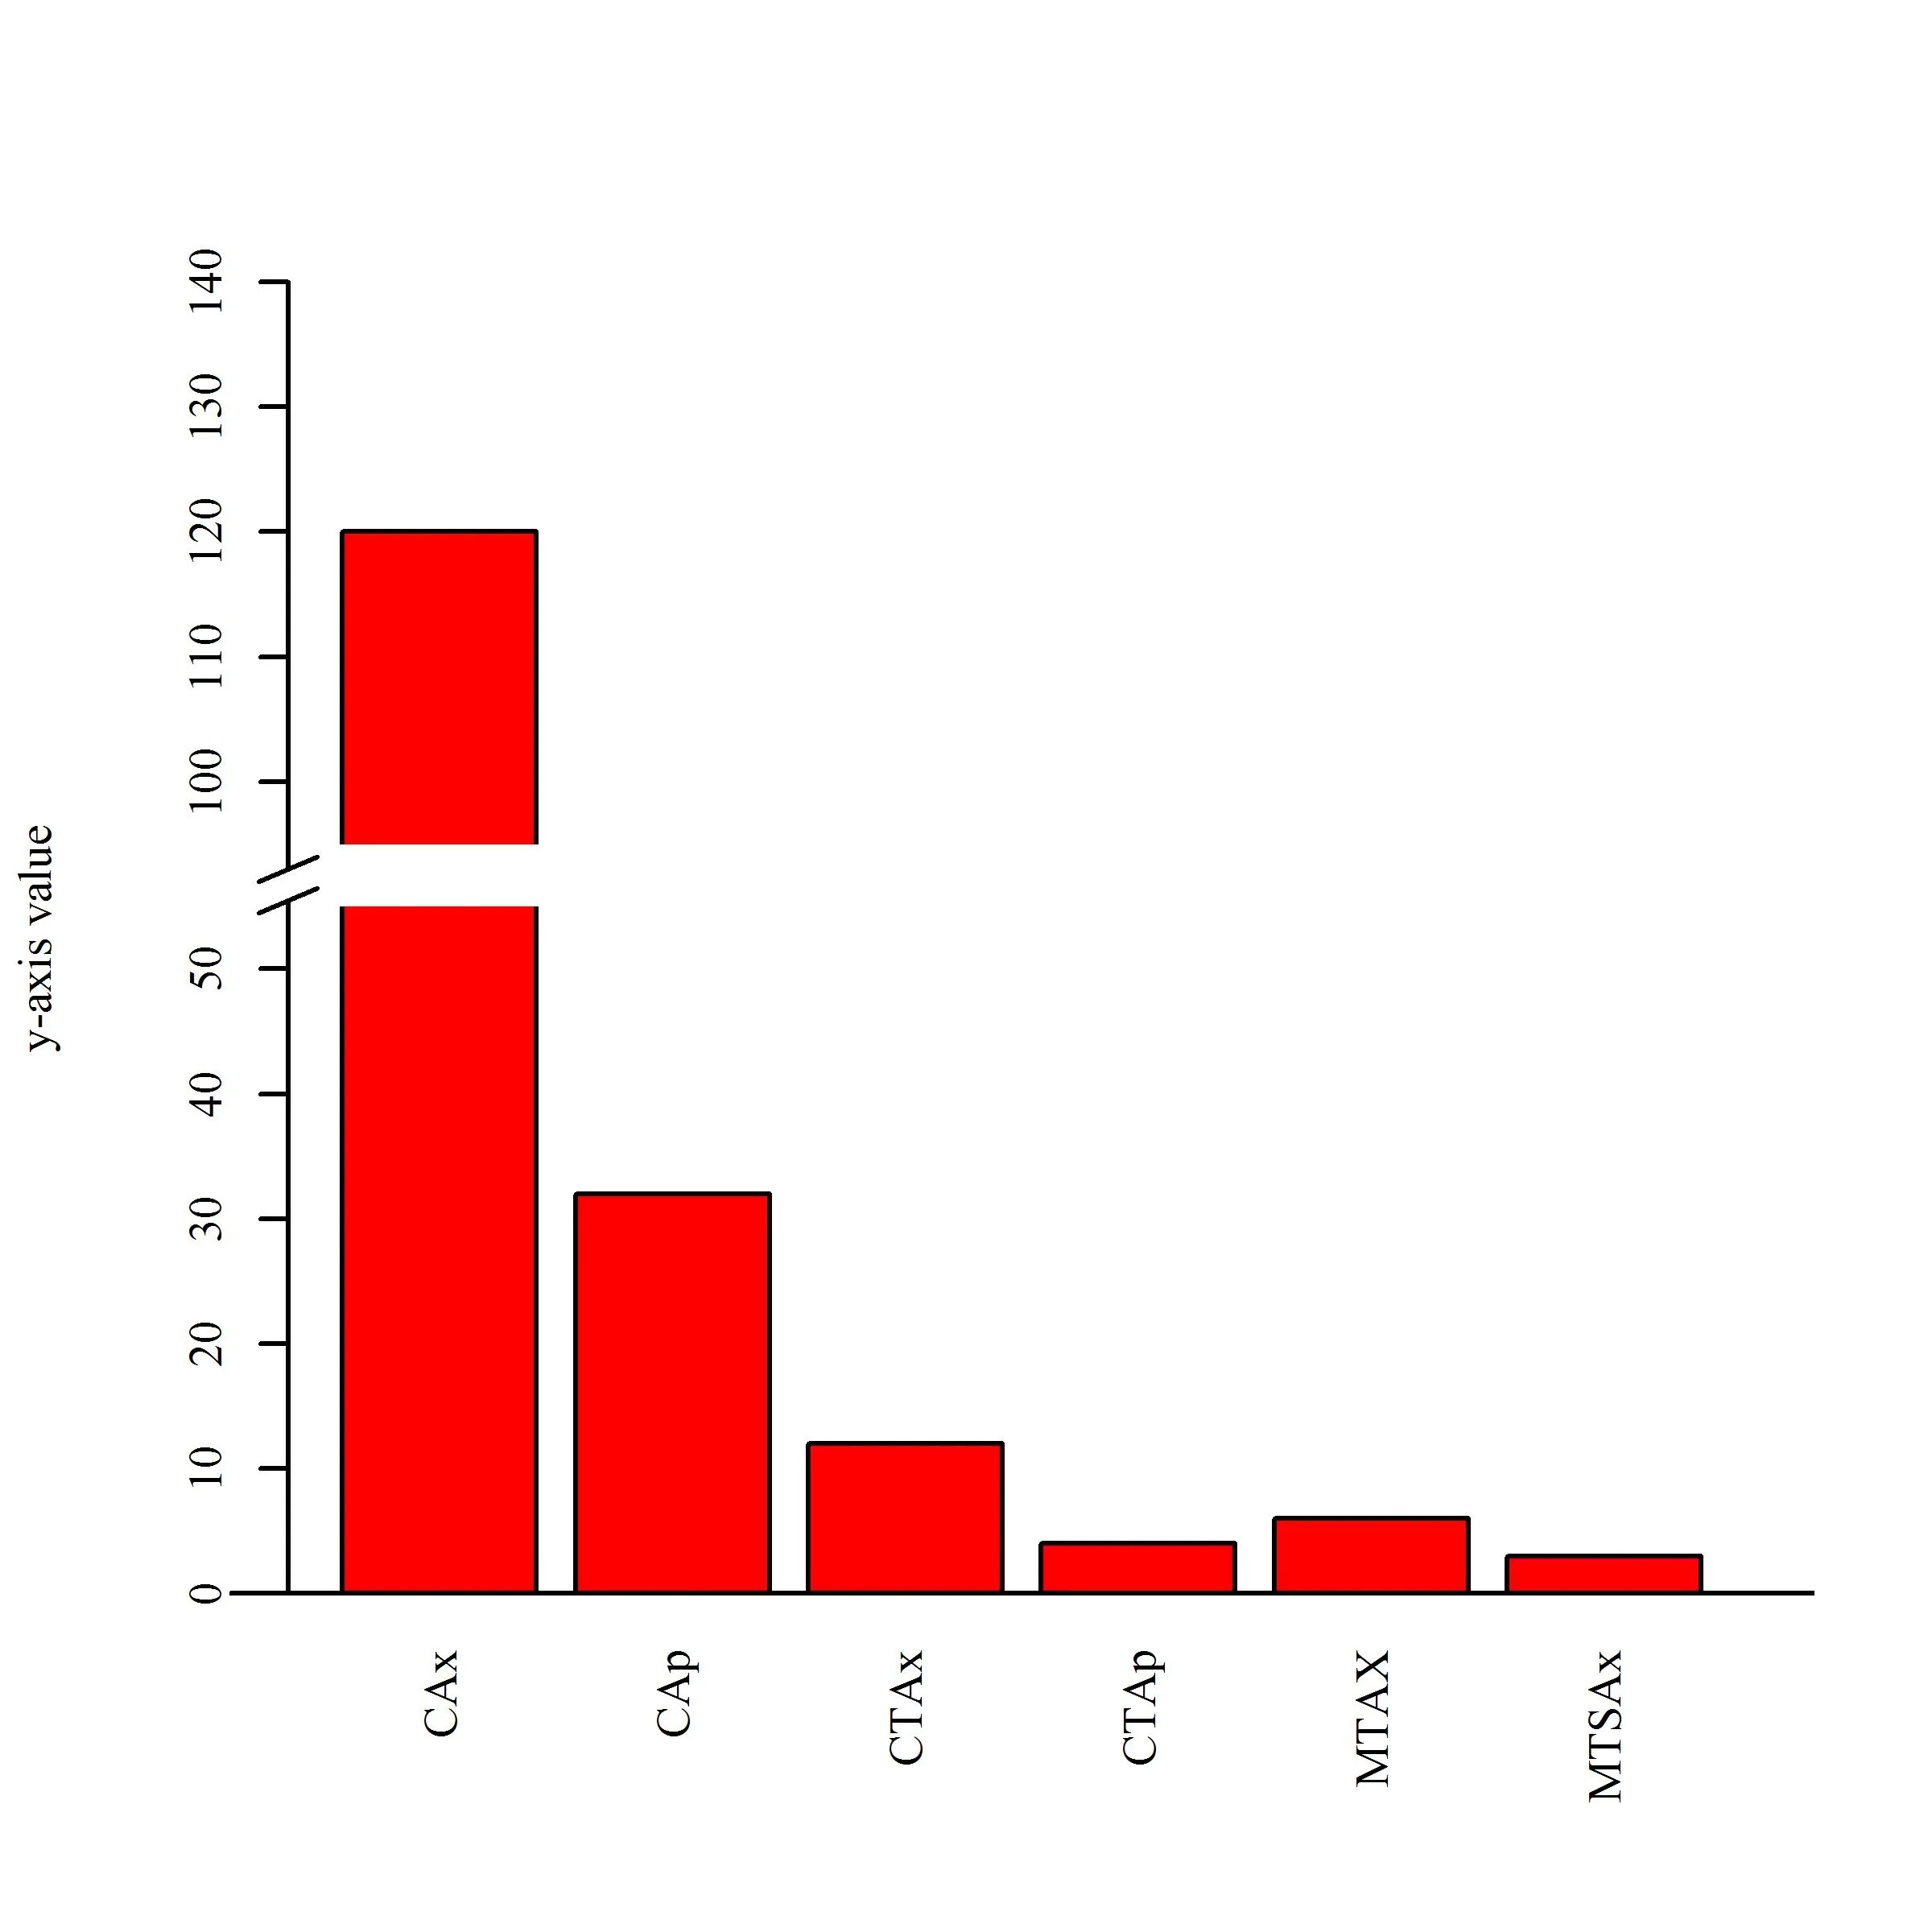
我正在尝试制作一个带有误差条的y轴断裂的条形图。我知道plotrix包中的gap.plot可以做到这一点,但我不喜欢它的外观。我按照这里给出的代码进行操作,除了我不知道如何放置误差条之外,它对我很有效。我的代码如下:
# dataset:
data=data.frame(CAx=c(120),CAp=c(32),CTAx=c(12),CTAp=c(4),MTAX=c(6),MTSAx=c(3))

lower=c(0,55)
upper=c(95,140)
y_outer=21

lowspan=c(0,11)
topspan=c(lowspan[2]+1,21)

ylabel="y-axis value"
xlabel="x-axis value"
legendtext=c('C-Ax','C-Ap','CT-Ax','CT-Ap','MT-AX','MTS-Ax')

cnvrt.coords <-function(x,y=NULL){
  xy <- xy.coords(x,y, recycle=TRUE)
  cusr <- par('usr')
  cplt <- par('plt')
  plt <- list()
  plt$x <- (xy$x-cusr[1])/(cusr[2]-cusr[1])
  plt$y <- (xy$y-cusr[3])/(cusr[4]-cusr[3])
  fig <- list()
  fig$x <- plt$x*(cplt[2]-cplt[1])+cplt[1]
  fig$y <- plt$y*(cplt[4]-cplt[3])+cplt[3]
  return( list(fig=fig) )
}

subplot <- function(fun, x, y=NULL){
  old.par <- par(no.readonly=TRUE)
  on.exit(par(old.par))
  xy <- xy.coords(x,y)
  xy <- cnvrt.coords(xy)$fig
  par(plt=c(xy$x,xy$y), new=TRUE)
  fun
  tmp.par <- par(no.readonly=TRUE)
  return(invisible(tmp.par))
}

plot(c(0,1),c(0,y_outer),type='n',axes=FALSE,ylab=ylabel,xlab='',lwd=7)
subplot(barplot(as.matrix(data),col=heat.colors(2),ylim=lower,xpd=FALSE,las=3),x=c(0,1),y=lowspan)

subplot(barplot(
as.matrix(data),
col=heat.colors(2),
ylim=upper,
xpd=FALSE,
names.arg=vector(mode="character",length=length(data))),
x=c(0,1),
y=topspan)

lowertop=lowspan[2]+0.1     # Where to end the lower axis
breakheight=0.5   # Height of the break
upperbot=lowertop+breakheight # Where to start the upper axes
markerheight=0.4 # Heightdifference for the break markers
markerwidth=.04  # With of the break markers
abline(h = 0, col = "black")
lines(c(0,0),c(1,lowertop))
lines(c(markerwidth/-2,markerwidth/2),c(lowertop-
markerheight/2,lowertop+markerheight/2))
lines(c(0,0),c(upperbot,14))
lines(c(markerwidth/-2,markerwidth/2),c(upperbot-
markerheight/2,upperbot+markerheight/2))
图表如下所示: