我正在尝试使用Python Matplotlib中的contourf函数“绘制”一个立方体的面。这可能吗?
这类似于这里所做的想法,但显然我不能使用补丁。同样,我认为我不能像这样使用add_collection3d,因为它只支持PolyCollection、LineColleciton和PatchCollection。
我一直在尝试在fig.gca(projection='3d')上使用contourf。以下是玩具示例。
from mpl_toolkits.mplot3d import Axes3D
import matplotlib.pyplot as plt
import numpy as np

plt.close('all')
fig = plt.figure()
ax = fig.gca(projection='3d')

############################################
#  plotting the 'top' layer works okay...  #
############################################

X = np.linspace(-5, 5, 43)
Y = np.linspace(-5, 5, 28)
X, Y = np.meshgrid(X, Y)

varone=np.random.rand(75,28,43)
Z=varone[0,:,:]
cset = ax.contourf(X, Y, Z, zdir='z', offset=1,
                levels=np.linspace(np.min(Z),np.max(Z),30),cmap='jet')
#see [1]
plt.show()

#################################################
#  but now trying to plot a vertical slice....  #
#################################################

plt.close('all')
fig = plt.figure()
ax = fig.gca(projection='3d')

Z=varone[::-1,:,-1]
X = np.linspace(-5, 5, 28)
Y = np.linspace(-5, 5, 75)
X, Y = np.meshgrid(X, Y)

#this 'projection' doesn't result in what I want, I really just want to rotate it
cset = ax.contourf(X, Y, Z, offset=5,zdir='x',
                levels=np.linspace(np.min(Z),np.max(Z),30),cmap='jet')

#here's what it should look like....
ax=fig.add_subplot(1, 2,1)
cs1=ax.contourf(X,Y,Z,levels=np.linspace(np.min(Z),np.max(Z),30),cmap='jet')
#see [2]
plt.show()
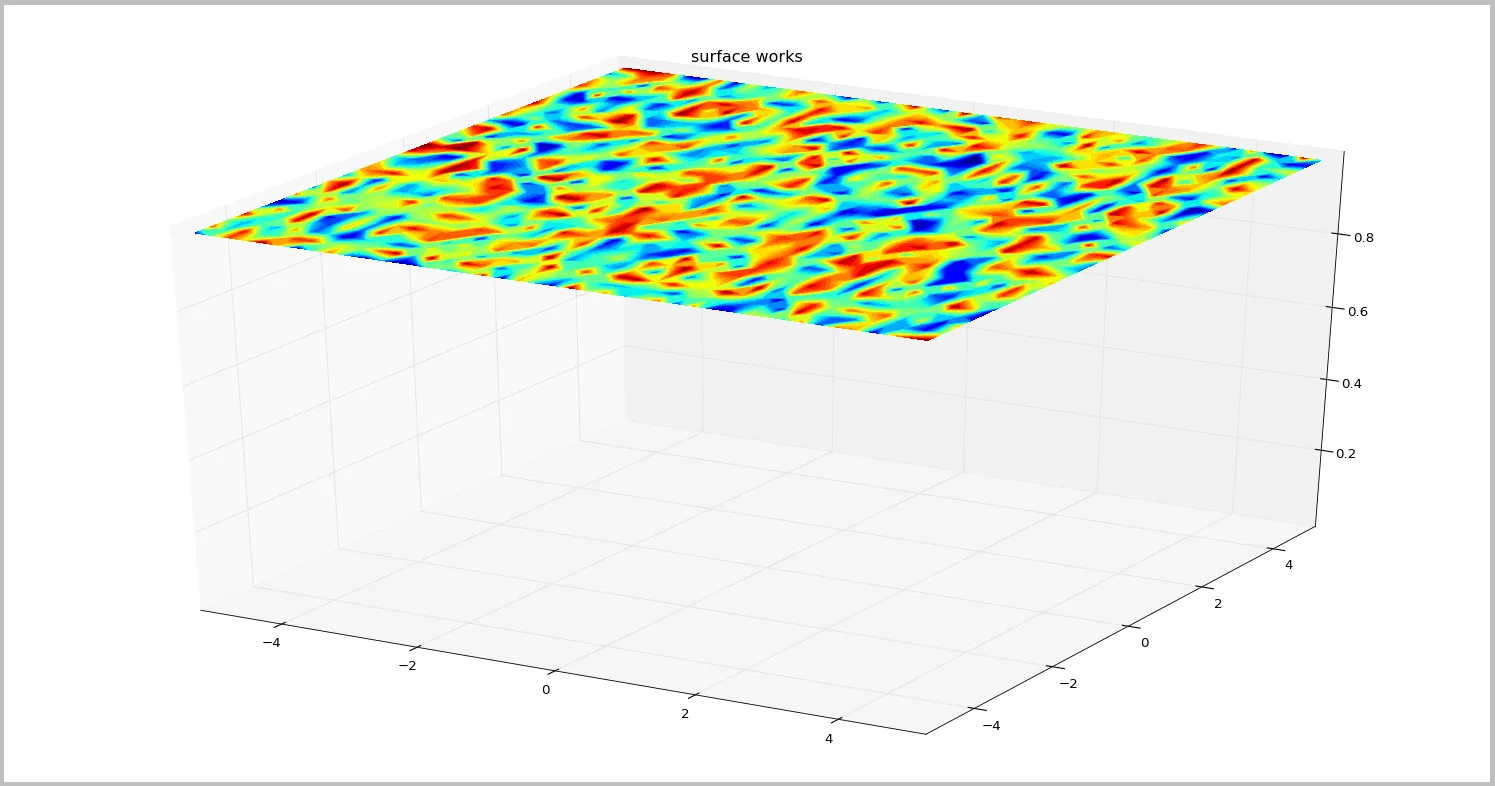
1 从这个例子中,顶部表面很容易绘制:
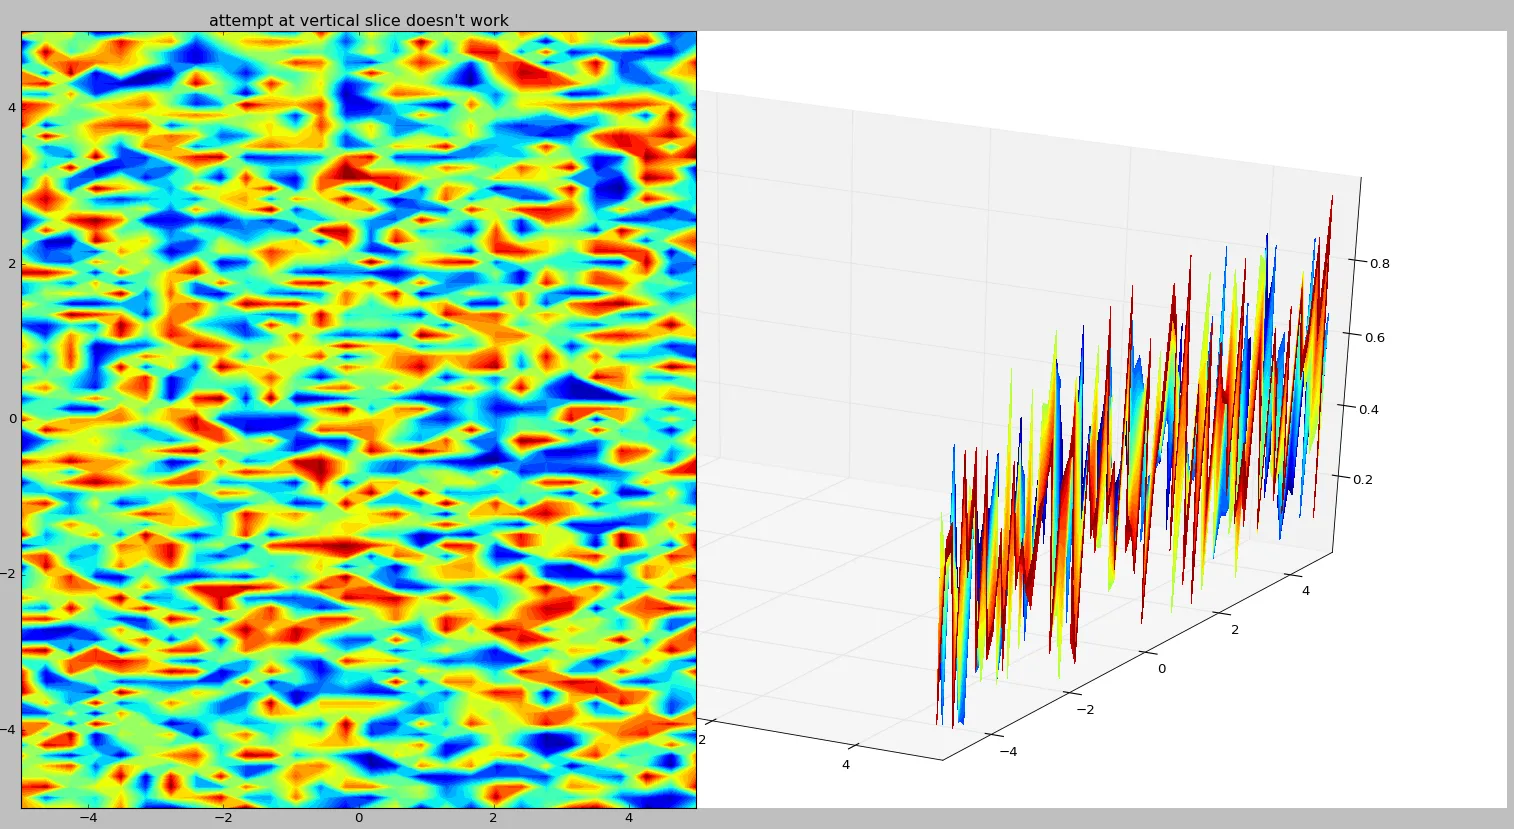
2 但我不确定如何绘制侧面。这个图的左侧是该截面应该看起来的样子(但是旋转了)...
欢迎尝试其他 Python 方法。我实际绘制的数据是地球物理学的 netcdf 文件。