我创建了一个自定义的cmap和ticklabels来制作带有contourf的图形,但并非所有的ticklabels和颜色都被colorbar考虑,然而当我使用imshow时,我得到了想要的结果。这是我的代码。
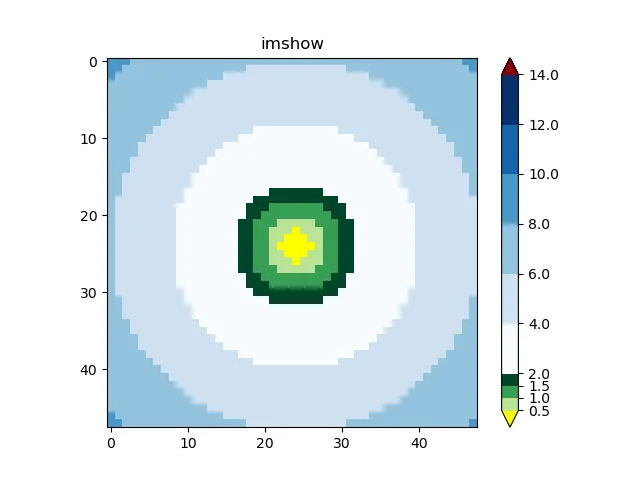
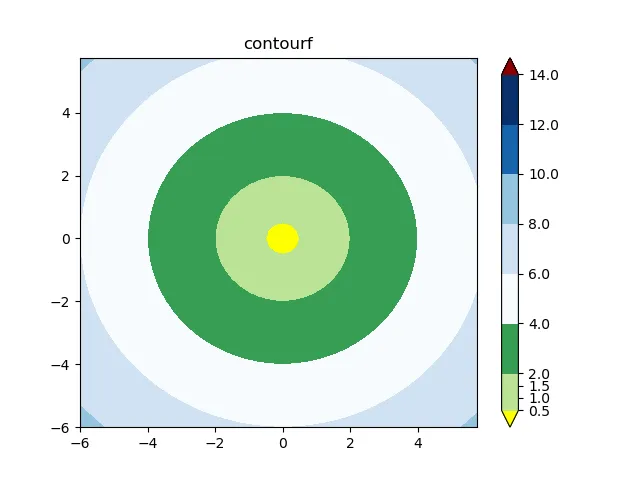
这是使用imshow和contourf的结果。请注意imshow的colorbar,绿色颜色从0.5到2.0,蓝色颜色从2.0到14.0,这是我想要的结果。但是,使用contourf结果不同。 我的错误是什么?我忘记设置任何参数了吗?
import numpy as np
import matplotlib.pyplot as plt
from matplotlib.colors import ListedColormap, LinearSegmentedColormap
from matplotlib.colors import BoundaryNorm

x = np.arange(-6,6,0.25)
y = np.arange(-6,6,0.25)
x, y = np.meshgrid(x,y)
z = np.sqrt(x**2+y**2)


newcolors = np.vstack((plt.cm.YlGn(np.linspace(0, 1, 4))[1:,:], plt.cm.Blues(np.linspace(0, 1, 6))))
palette = ListedColormap(newcolors, name='test')

palette.set_over('darkred')
palette.set_under('yellow')

tickslabels=[0.5,1.0,1.5,2.0,4.0,6.0,8.0,10.0,12.0,14.0]
norm=BoundaryNorm(tickslabels, len(tickslabels)-1)


fig1 = plt.figure('imshow')
img=plt.imshow(z, cmap=palette, norm=norm)
plt.colorbar(img, ticks=tickslabels, spacing='proportional', extend='both')
plt.title('imshow')


fig2 = plt.figure('contourf')
img=plt.contourf(x, y, z, cmap=palette, levels=tickslabels, extend='both') #norm=norm)
plt.colorbar(img, ticks=tickslabels, spacing='proportional', extend='both')
plt.title('contourf')

plt.show()
这是使用imshow和contourf的结果。请注意imshow的colorbar,绿色颜色从0.5到2.0,蓝色颜色从2.0到14.0,这是我想要的结果。但是,使用contourf结果不同。 我的错误是什么?我忘记设置任何参数了吗?