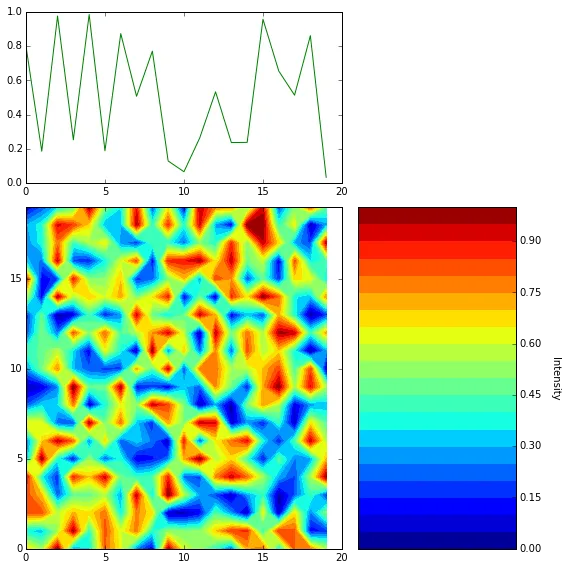
这是一个与"如何在不同的子图中绘制pcolor colorbar - matplotlib"非常相似的问题。我正在尝试绘制一个填充轮廓图和一条线图,共享一个轴,并在单独的子图中绘制颜色条(即使它不占用contourf轴的空间,从而混淆x轴共享)。然而,我的代码中的x轴不能很好地重新调整比例。
该代码会产生一个x轴范围从0到20(包括20)而不是从0到19的填充等高线图,这意味着在图中会有不美观的空白。将上述代码中的
import numpy as np
import matplotlib as mpl
import matplotlib.pyplot as plt

z = np.random.rand(20, 20)
x, y = np.arange(20), np.arange(20)
y2 = np.random.rand(20)
fig = plt.figure(figsize=(8, 8))
gs = mpl.gridspec.GridSpec(2, 2, height_ratios=[1, 2], width_ratios=[2, 1])
ax1 = fig.add_subplot(gs[1, 0])
ax2 = fig.add_subplot(gs[0, 0], sharex=ax1)
ax3 = fig.add_subplot(gs[1, 1])
cont = ax1.contourf(x, y, z, 20)
plt.tick_params(which='both', top=False, right=False)
ax2.plot(x, y2, color='g')
plt.tick_params(which='both', top=False, right=False)
cbar = plt.colorbar(cont, cax=ax3)
cbar.set_label('Intensity', rotation=270, labelpad=20)
plt.tight_layout()
plt.show()
该代码会产生一个x轴范围从0到20(包括20)而不是从0到19的填充等高线图,这意味着在图中会有不美观的空白。将上述代码中的
sharex=ax1注释掉意味着等高线图的x轴尺度很好,但是上面的线图和plt.tick_params代码对任何轴都没有影响。
有没有解决这个问题的方法?
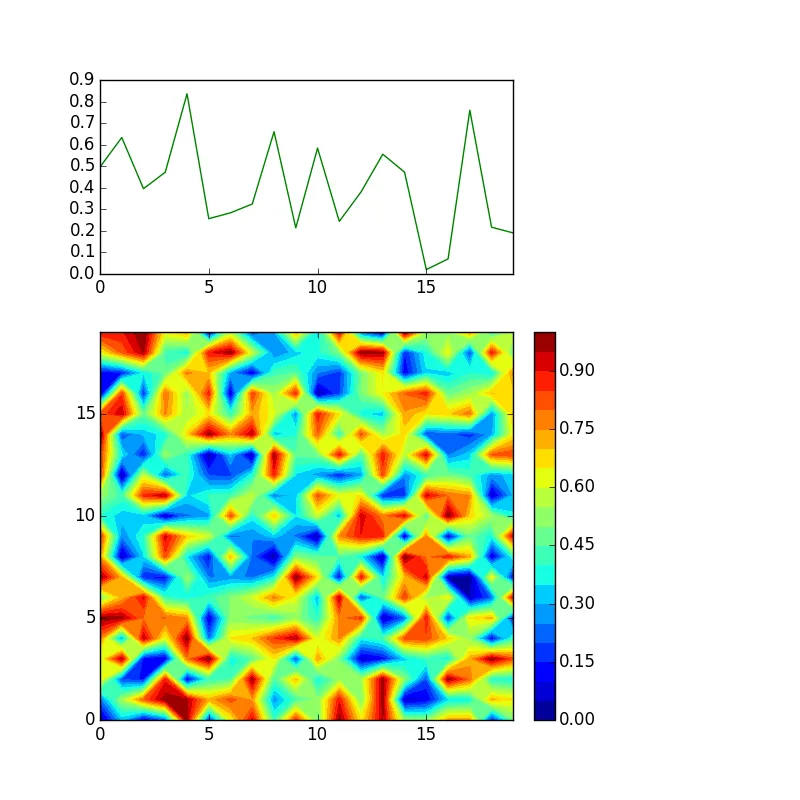
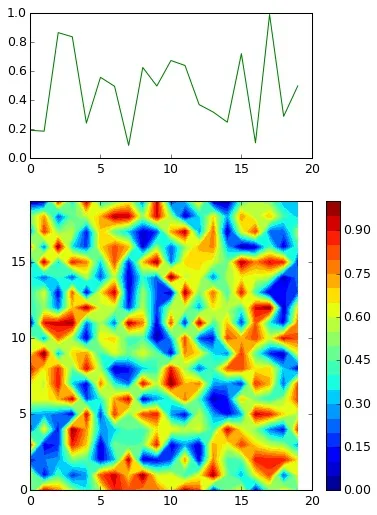
ax1.set_xlim(0, 19)应该是一个快速解决方法。 - celax1.set_xlim不起作用。我应该在问题中提到这一点。似乎contourf的意外行为干扰或阻止了轴方法。 - t.woodxlim设置为 @cel 建议的值对我有效:http://i.imgur.com/LvR3UnF.png - tmdavisonset_xlim很好用。此外,使用ax1.set_params()也可以,而plt.set_params()则不行。不知道为什么。 - t.wood