在matplotlib中,如何对contourf绘图进行部分遮罩?

10
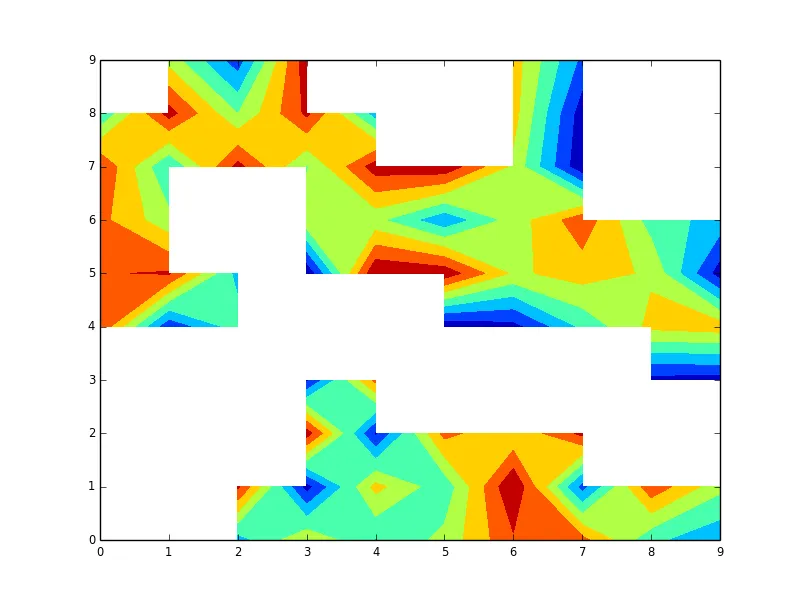
我正在尝试使用contourf在matplotlib中生成填充的等高线图。 在底部附近以锯齿状模式缺少数据。 等高线图不仅在原始数据掩盖的位置为空白,而且在等高线算法无法干净地插值因为好的数据邻域不足的口袋中也是如此。
我知道如何扩展数据集以在这些口袋中产生合理的等高线。 但是,如果我绘制扩展的数据,就会得到填充的等高线图。 我想用黑色或白色掩盖原始数据缺失的区域。
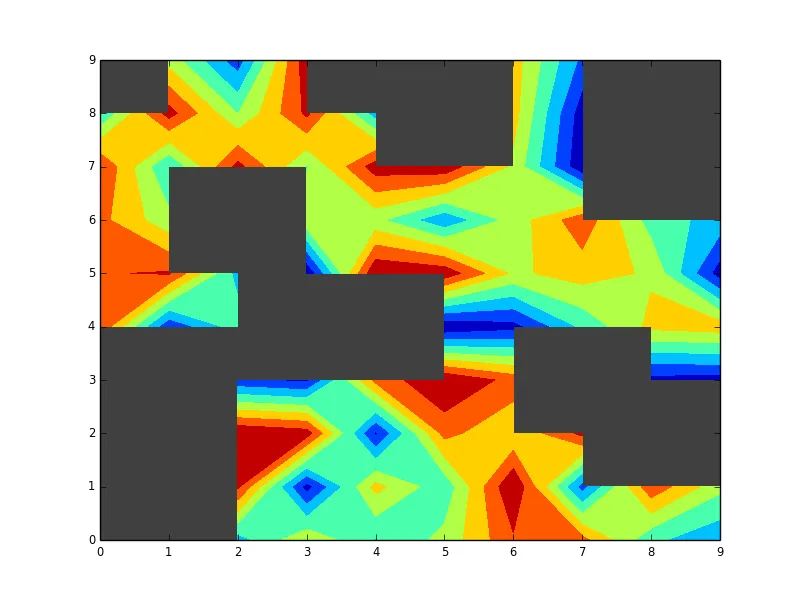
在以前的主题上,我学习了如何通过绘制第一张图像,然后用另一张图像覆盖它来遮盖坏区域。 下面的代码片段的类似物,但不适用于等高线...我无法让bad_data imshow覆盖扩展的contourf图。 可能吗?
谢谢, Eli
import matplotlib.pyplot as plt
lev = [0.0,0.1,0.2,0.5,1.0,2.0,4.0,8.0,16.0,32.0]           
norml = colors.BoundaryNorm(lev, 256)
# this is the contour plot, using extended_data so that the contours are plausibly extended
cs = plt.contourf(x,z,extended_data,levels = lev, cmap = cm.RdBu_r,norm = norml) 
# now the attempt to cover it up -- but imshow will not cover up the original plot as it will with another image
bad_data = np.ma.masked_where(~data.mask, data.mask, copy=True) 
plt.imshow(bad_data, interpolation='nearest', aspect = 'auto', cmap=cm.gray)
plt.show()

我应该补充说明,在发布这篇文章之后,我意识到我可以识别区域并使用fill()来阻止该区域。因此,紧急性较低,但仍然有价值知道是否可以做到这一点。 - Eli S
假设您有一个5x5的数组,索引[1,1]缺失了,您会期望看到什么?索引[1,1]会被绘制为标记吗? - pelson
1
你能否提供一个最小可行示例吗? - EnricoGiampieri
1个回答

14

如果我理解正确,你目前面临这种情况:

import numpy as np
import matplotlib.pyplot as plt
# generate some data with np.nan values (the missing values)
d = np.random.rand(10, 10)
d[2, 2], d[3, 5] = np.nan, np.nan
# and in your case you actually have masked values too:
d = np.ma.array(d, mask=d < .2)
# now all of the above is just for us to get some data with missing (np.nan) and
# masked values

通过使用contourf方法绘制上述内容,

plt.contourf(d)
plt.show()

我会的:

我得到:

enter image description here

这不显示(空白)被屏蔽的值(d < .2)和np.nan值(d[2, 2],d[3, 5])!你希望matplotlib仅不显示掩码值。因此,我们可以这样做:

# the following line is replaced by your interpolation routine for
# removing np.nan values
d[np.isnan(d)] = 1
# then because we use the masked array only the masked values will still be masked
# but the np.nan values which were replaced through the interpolation algorithm
# will show up if we do the contourf plot
plt.contourf(d)
plt.show()

我不知道在这种情况下使用掩码数组有多快,但无论如何,这就是我的做法。如果你想要一个不同颜色的区域代替空白点(白色),你需要着色坐标轴下面的补丁,因为contourf实际上不会绘制任何没有数据或掩码数据的地方:

# make the background dark gray (call this before the contourf)
plt.gca().patch.set_color('.25')
plt.contourf(d)
plt.show()

获取:

这里输入图片描述


网页内容由stack overflow 提供, 点击上面的
可以查看英文原文,
原文链接