我尝试查看MatLab文档,链接如下:
http://www.mathworks.com/help/matlab/ref/interp3.html
然后在
help interp3
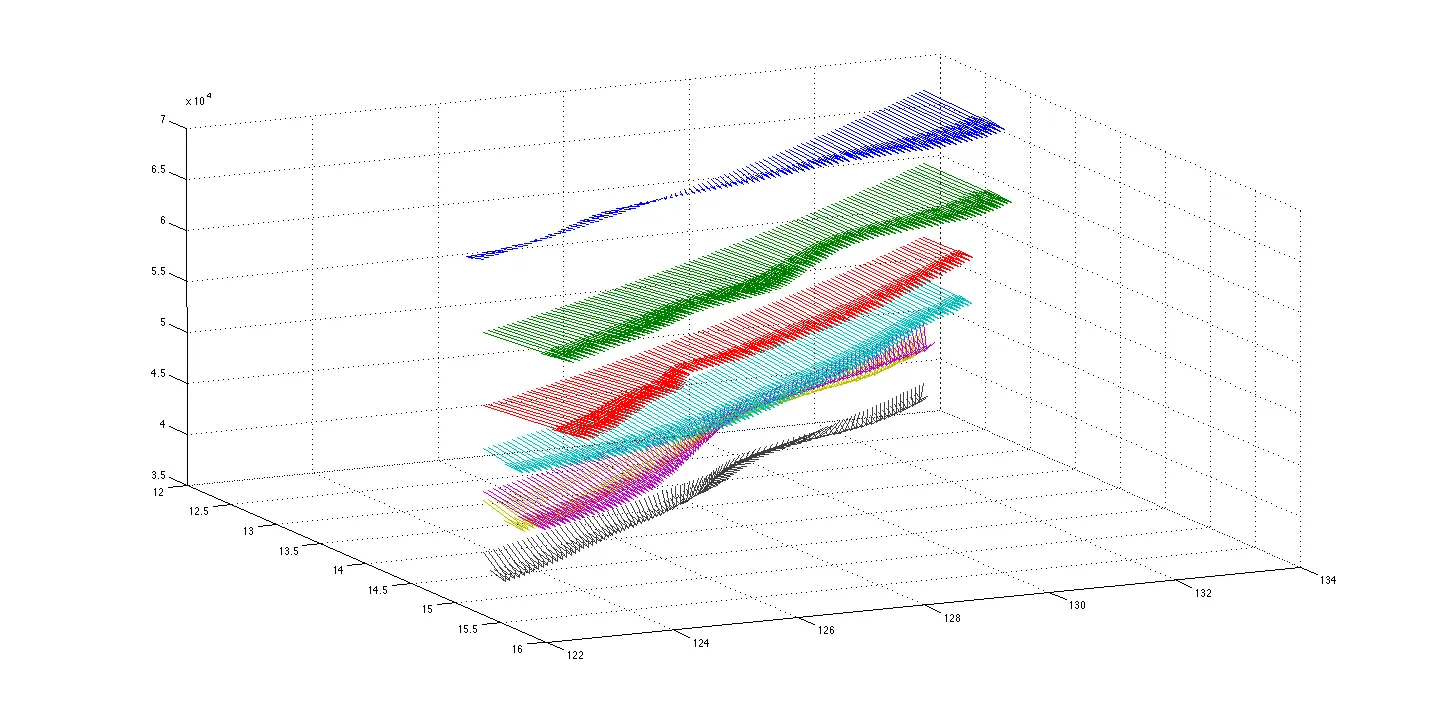
我正在研究MatLab的部分内容,但我很难确定我真正需要什么,以及interp3是否是我要找的东西。但是,我可能只是不理解我现在的布局方式是否能够使用interp3。我附上了一张我从编写的MatLab程序中创建的图。它使用NOAA的纬度/经度(x/y),U/V方向的风速向量,以及2D水平面的Z值。
使用以下格式:
quiver3(x,y,z,u,v,w)
将"W"分量设置为0。
这只是场中非常小的一部分,但我试图做的是在这些2D矢量场之间插值,以创建一个3D场。
我是否需要将U/X、V/Y和W/Z分组成它们自己的向量才能使用interp3?我仍然不确定3D函数“V”部分是否在interp3语法中。
Vq = interp3(X,Y,Z,V,Xq,Yq,Zq)
这是一个非常小的领域,但我正在尝试插值这些2D向量场以创建一个3D向量场。
我的代码:
tic
clc
clear all

% You will have to change the directory to wherever you place the read_grib.r4
% file. In addition, It's necessary to have an external compiler connected
% to MatLab in order to build the mex-file that gives you the power to use
% the read_grib decoding. This is really tricky. On OSX I used Xcode as an
% environment and MatLab virtually worked immediately. On Windows, I have
% 2012(b) and had to use the call system('mxvc <BDS_unpack_mex5.c>') which
% utilized Microsoft's C-compiler that I had SOMEWHERE on my computer
% thankfully (may be pre-intalled). There are tutorials online for
% different compilers. In addition, if you're smart about it you can add
% the mex-file build to the start-up operations so you never have to worry
% about it, but my questionably legal MatLab copies seem to make this a
% little more difficult.

cd /Users/Sargent_PC/Downloads/read_grib.r4/
mex BDS_unpack_mex5.c

% ** Inventory doesn't need to be done every iteration  **
% ** Uncomment the line below to get a record inventory **
%read_grib('NOAAdata.grb','inv');

% Creating a struct named "grib_struct" for each of the records I'm
% extracting out of the grib file. They exist in pairs with 6 records
% separating them. Should we want to extract ALL of the U and V wind
% components I'll iterate with a simple for-loop.

grib_struct=read_grib('NOAAdata.grb', [60,61,66,67]); %,72,73,78,79,84,85,90,91,96,97]);
UwindVec50mb  = grib_struct(1).fltarray;  %rec60
VwindVec50mb  = grib_struct(2).fltarray;  %rec61
UwindVec75mb  = grib_struct(3).fltarray;  %rec66
VwindVec75mb  = grib_struct(4).fltarray;  %rec67
% UwindVec100mb = grib_struct(5).fltarray;  %rec72
% VwindVec100mb = grib_struct(6).fltarray;  %rec73
% UwindVec125mb = grib_struct(7).fltarray;  %rec78
% VwindVec125mb = grib_struct(8).fltarray;  %rec79
% UwindVec150mb = grib_struct(9).fltarray;  %rec84
% VwindVec150mb = grib_struct(10).fltarray; %rec85
% UwindVec175mb = grib_struct(11).fltarray; %rec90
% VwindVec175mb = grib_struct(12).fltarray; %rec91
% UwindVec200mb = grib_struct(13).fltarray; %rec96
% VwindVec200mb = grib_struct(14).fltarray; %rec97

%50mb  range has records 60 and 61 for U and V respectively.
%75mb  range has records 66 and 67 for U and V respectively.
%100mb range has records 72 and 73 for U and V respectively.
%125mb range has records 78 and 79 for U and V respectively.
%150mb range has records 84 and 85 for U and V respectively.
%175mb range has records 90 and 91 for U and V respectively.
%200mb range has records 96 and 97 for U and V respectively.

%These extracted sections of the grib file will read "extracted" on the
%left-hand side should they be successfully extracted.

load NOAAlatlongdata;                    % read the data into a matrix
lat_value = NOAAlatlongdata(:,3);        %  copy first column of NOAAlatlongdata into lat_value
long_value = NOAAlatlongdata(:,4);       %  and second column of NOAAlatlongdata into long_value


% I was going to add in a pressure to altitude change here, but
% it may be in our best interest to get a list of values for each
% pressure level that correspond to altitude and create our own
% vector of those values in order to simplify the calculations that
% the program has to do.

% z50mb_val = ;
% z75mb_val = ;
% z100mb_val= ;
% z125mb_val= ;
% z150mb_val= ;
% z175mb_val= ;
% z200mb_val= ;

% Creating vectors of the Z-values which are gotten from converting the
% pressure value to altitude. I feel like this is a very bulky way to do
% this, and I've included the tic-toc timing to show that it's ~30seconds
% per vector creation. For each altitude level that we add you'll add
% ~30seconds JUST to the vector creation component of the program.

tic; for i = 1:262792, z50mb_vec=67507*ones(i,1);  end; toc;

tic; for i = 1:262792, z75mb_vec=60296*ones(i,1);  end; toc;

% tic; for i = 1:262792, z100mb_vec=53084*ones(i,1); end; toc;
%
% tic; for i = 1:262792, z125mb_vec=48865*ones(i,1); end; toc;
%
% tic; for i = 1:262792, z150mb_vec=44646*ones(i,1); end; toc;
%
% tic; for i = 1:262792, z175mb_vec=43763*ones(i,1);  end; toc;
%
% tic; for i = 1:262792, z200mb_vec=38661*ones(i,1); end; toc;
%
 tic; for i = 1:262792, W_zerovec = 0*ones(i,1);    end; toc;
%

% 3D quiver plots format: quiver3(x,y,z,u,v,w) -- Make sure dimensionality
% of all 6 components to that plot match up before plotting.

quiver3((lat_value(1:101)), (long_value(1:25)), ( z50mb_vec(1:25)), (UwindVec50mb(1:25)) ,(VwindVec50mb(1:25)) , W_zerovec(1:25))
hold on
quiver3((lat_value(1:101)), (long_value(1:251)), ( z75mb_vec(1:25)), (UwindVec75mb(1:25)) ,(VwindVec75mb(1:25)) , W_zerovec(1:25))
hold on
% quiver3((lat_value(1:101)), (long_value(1:101)), (z100mb_vec(1:101)), (UwindVec100mb(1:101)),(VwindVec100mb(1:101)), W_zerovec(1:101))
% hold on
% quiver3((lat_value(1:101)), (long_value(1:101)), (z125mb_vec(1:101)), (UwindVec125mb(1:101)),(VwindVec125mb(1:101)), W_zerovec(1:101))
% hold on
% quiver3((lat_value(1:101)), (long_value(1:101)), (z150mb_vec(1:101)), (UwindVec150mb(1:101)),(VwindVec150mb(1:101)), W_zerovec(1:101))
% hold on
% quiver3((lat_value(1:101)), (long_value(1:101)), (z175mb_vec(1:101)), (UwindVec175mb(1:101)),(VwindVec175mb(1:101)), W_zerovec(1:101))
% hold on
% quiver3((lat_value(1:101)), (long_value(1:101)), (z200mb_vec(1:101)), (UwindVec200mb(1:101)),(VwindVec200mb(1:101)), W_zerovec(1:101))

toc