我想使用matplotlib来说明两个区域x_0和x_1之间的定积分。
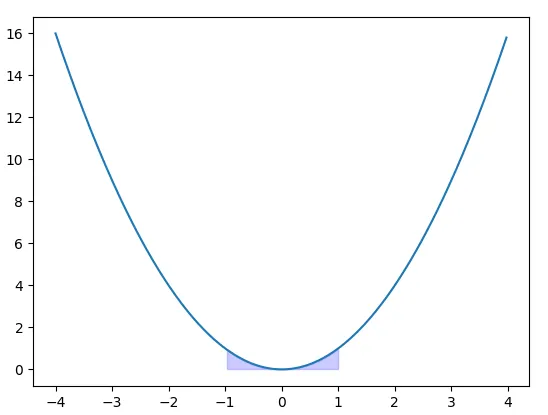
如果给定以下图形,我该如何在matplotlib中为曲线下的区域从x=-1到x=1着色?
import numpy as np
from matplotlib import pyplot as plt
def f(t):
    return t * t

t = np.arange(-4,4,1/40.)
plt.plot(t,f(t))
我想使用matplotlib来说明两个区域x_0和x_1之间的定积分。
如果给定以下图形,我该如何在matplotlib中为曲线下的区域从x=-1到x=1着色?
import numpy as np
from matplotlib import pyplot as plt
def f(t):
return t * t
t = np.arange(-4,4,1/40.)
plt.plot(t,f(t))
fill_between。我原本以为有一种简单的方法可以实现阴影效果,但这个函数恰好符合我的需求。section = np.arange(-1, 1, 1/20.)
plt.fill_between(section,f(section))
如前所述,您应该使用pyplot中的fill_between函数。
为了填充曲线下的所需区域,我建议使用提供适合您数据的过滤器的where参数:
import numpy as np
from matplotlib import pyplot as plt

def f(t):
    return t * t

t = np.arange(-4,4,1/40)

#Print the curve
plt.plot(t,f(t))

#Fill under the curve
plt.fill_between(
        x= t,
        y1= f(t),
        where= (-1 < t)&(t < 1),
        color= "b",
        alpha= 0.2)

plt.show()
where参数接受布尔数组,因此您可以使用布尔数组上的numpy数组操作来使其更容易。如示例所示,我只是简单地使用了:(-1 < t)&(t < 1)。有关布尔数组的更多详细信息,请参见此处:http://www.math.buffalo.edu/~badzioch/MTH337/PT/PT-boolean_numpy_arrays/PT-boolean_numpy_arrays.html
您可以调整参数alpha(不透明度)和color以使其外观更好。以下为所需结果:
fill_between的文档在此处可用:https://matplotlib.org/3.5.1/api/_as_gen/matplotlib.pyplot.fill_between.html