我想使用Matplotlib绘制直方图,但我希望bin的值表示总观测量的百分比。一个最小工作示例可以像这样:
#!/usr/bin/env python3
# -*- coding: utf-8 -*-
import matplotlib.pyplot as plt
import matplotlib.ticker as tck
import seaborn as sns
import numpy
sns.set(style='dark')
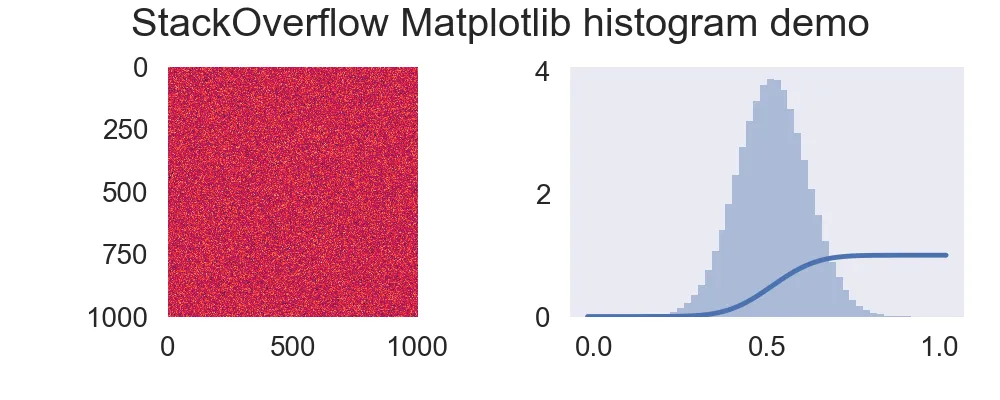
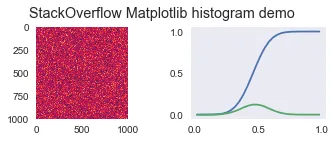
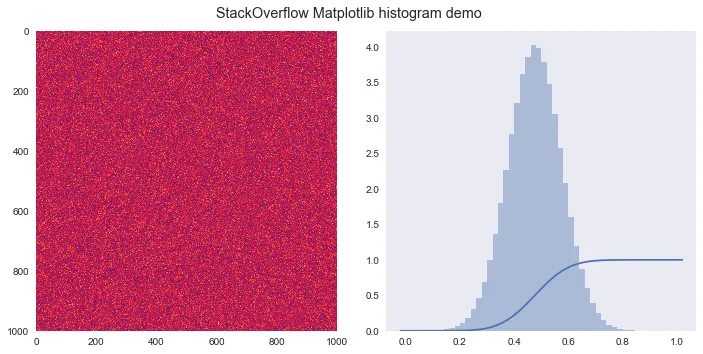
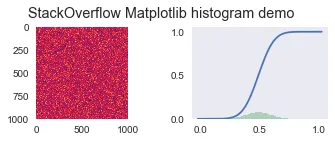
imagen2 = plt.figure(1, figsize=(5, 2))
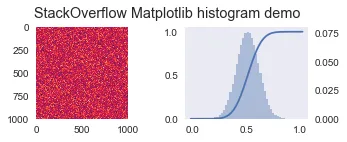
imagen2.suptitle('StackOverflow Matplotlib histogram demo')
luminance = numpy.random.randn(1000, 1000)
# "Luminance" should range from 0.0...1.0 so we normalize it
luminance = (luminance - luminance.min())/(luminance.max() - luminance.min())
top_left = plt.subplot(121)
top_left.imshow(luminance)
bottom_left = plt.subplot(122)
sns.distplot(luminance.flatten(), kde_kws={"cumulative": True})
# plt.savefig("stackoverflow.pdf", dpi=300)
plt.tight_layout(rect=(0, 0, 1, 0.95))
plt.show()
这里的CDF(累积分布函数)是正确的(范围:[0,1]),但是得到的直方图与我的预期不符:

sum(bin_heights*bin_widths) == 1.0。 - telnumpy.histogram函数自己计算它们。我已经在我的答案下面添加了一个例子。 - tel